Perspectives of Fiji from open data sets
Introduction

As part of preparing for a recent trip to Fiji, I looked to see what open data is available and what I could learn from it. I’m happy to report that there seems to be a lot more data available now compared to the last time I looked some years ago.
In the following pages I sketch from open data a small number of the characteristics of Fiji, natural and human-centered, and put them in context with other countries, including Pacific Island countries and territories (PICTs). This sketch will not capture the fullness of life in Fiji in the people, the land, or the sea. You have to go yourself to experience it.
The Republic of Fiji is an independent country straddling the international date line and located mostly between 16° and 18° South. It’s a 3-to-3.5 hour flight from Nadi, the primary international airport, to Auckland, New Zealand. Fiji Airways offers direct flights from Los Angeles and San Francisco that last more than 10 hours. Fiji is among the largest and most economically developed PICTs. Most of the non-governmental organizations serving the South Pacific seem to have their primary regional office in Fiji (they were my customers when I was general manager of South Seas Computing (Fiji) Ltd. in the nineties).
The articles about Fiji at Britannica.com, CIA Factbook 2023 and Wikipedia offer useful summaries that I won’t repeat here. Similarly, another source of interest (not used here) is this Fiji-specific fact sheet published by the Fiji Bureau of Statistics: Fact Sheet - preliminary findings of the Fiji Multiple Indicator Cluster Survey 2021 (MICS).
License
This text is licensed under CC BY 4.0 meaning you can share and adapt its content as long as you provide attribution. The source code that generated this text is licensed under the MIT License and is available at https://github.com/dmoul/fiji-perspectives.
Acknowledgements
I’m grateful to the organizations and individuals who made data available. For links to sources see 10 Notes and sources.
- Pacific Community (SPC) and the Pacific Data Hub, where the data was prepared in each country’s Bureau of Statistics, the UN, or international NGO.
- Fiji Bureau of Statistics
- U.S. National Oceanic and Atmospheric Administration (NOAA) Coral Reef Watch and NowCOAST
- GEBCO Grid2023 bathymetry
- Open Street Map and Open Sea Map
- New Zealand Land Information portal
- UN Global Reef Distribution project
- World Health Organization
- Reserve Bank of Fiji
- World Bank
- Federal Reserve Bank of Minneapolis
I’m also grateful to those in the R ecosystem who produce and maintain high-quality open source tools for data analysis and visualization, write tutorials, publish examples, and answer questions in forums that help countless people (like me!) who come along later. I used RStudio with the following packages published on CRAN.
- Tidyverse plus tidyverse-adjacent: patchwork, ggrepel, ggridges, scales, units, janitor, glue, here, gt
- GIS: sf, terra, tidyterra, rnaturalearth, osmdata, ISOcodes
– Daniel Moul
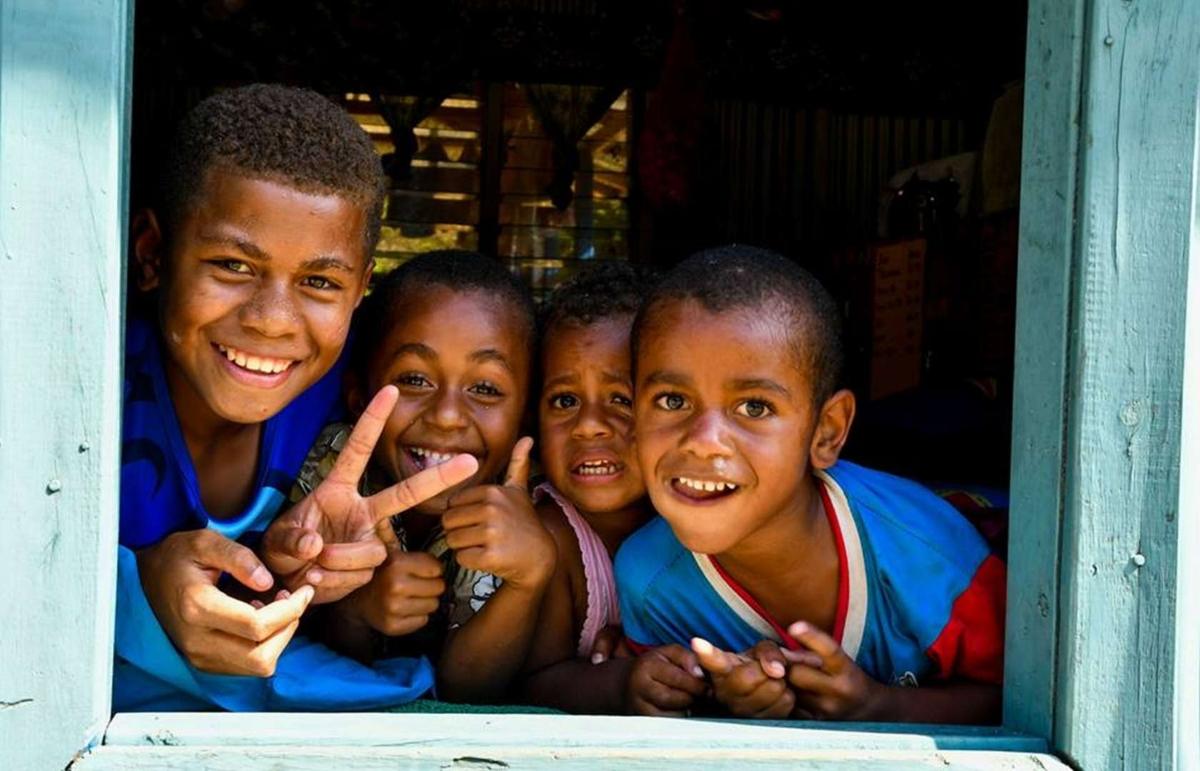
Cover image: The children of Nasauvakarua village located in the Western Division near the center of Viti Levu and the headwaters of the Sigatoka River. Source: https://fijiclimatechangeportal.gov.fj/gallery/climate-change/ specifically: https://fijiclimatechangeportal.gov.fj/wp-content/uploads/photo-gallery/Climate_Change/Children-of-Nasauvakarua-village.jpg?bwg=1644208434