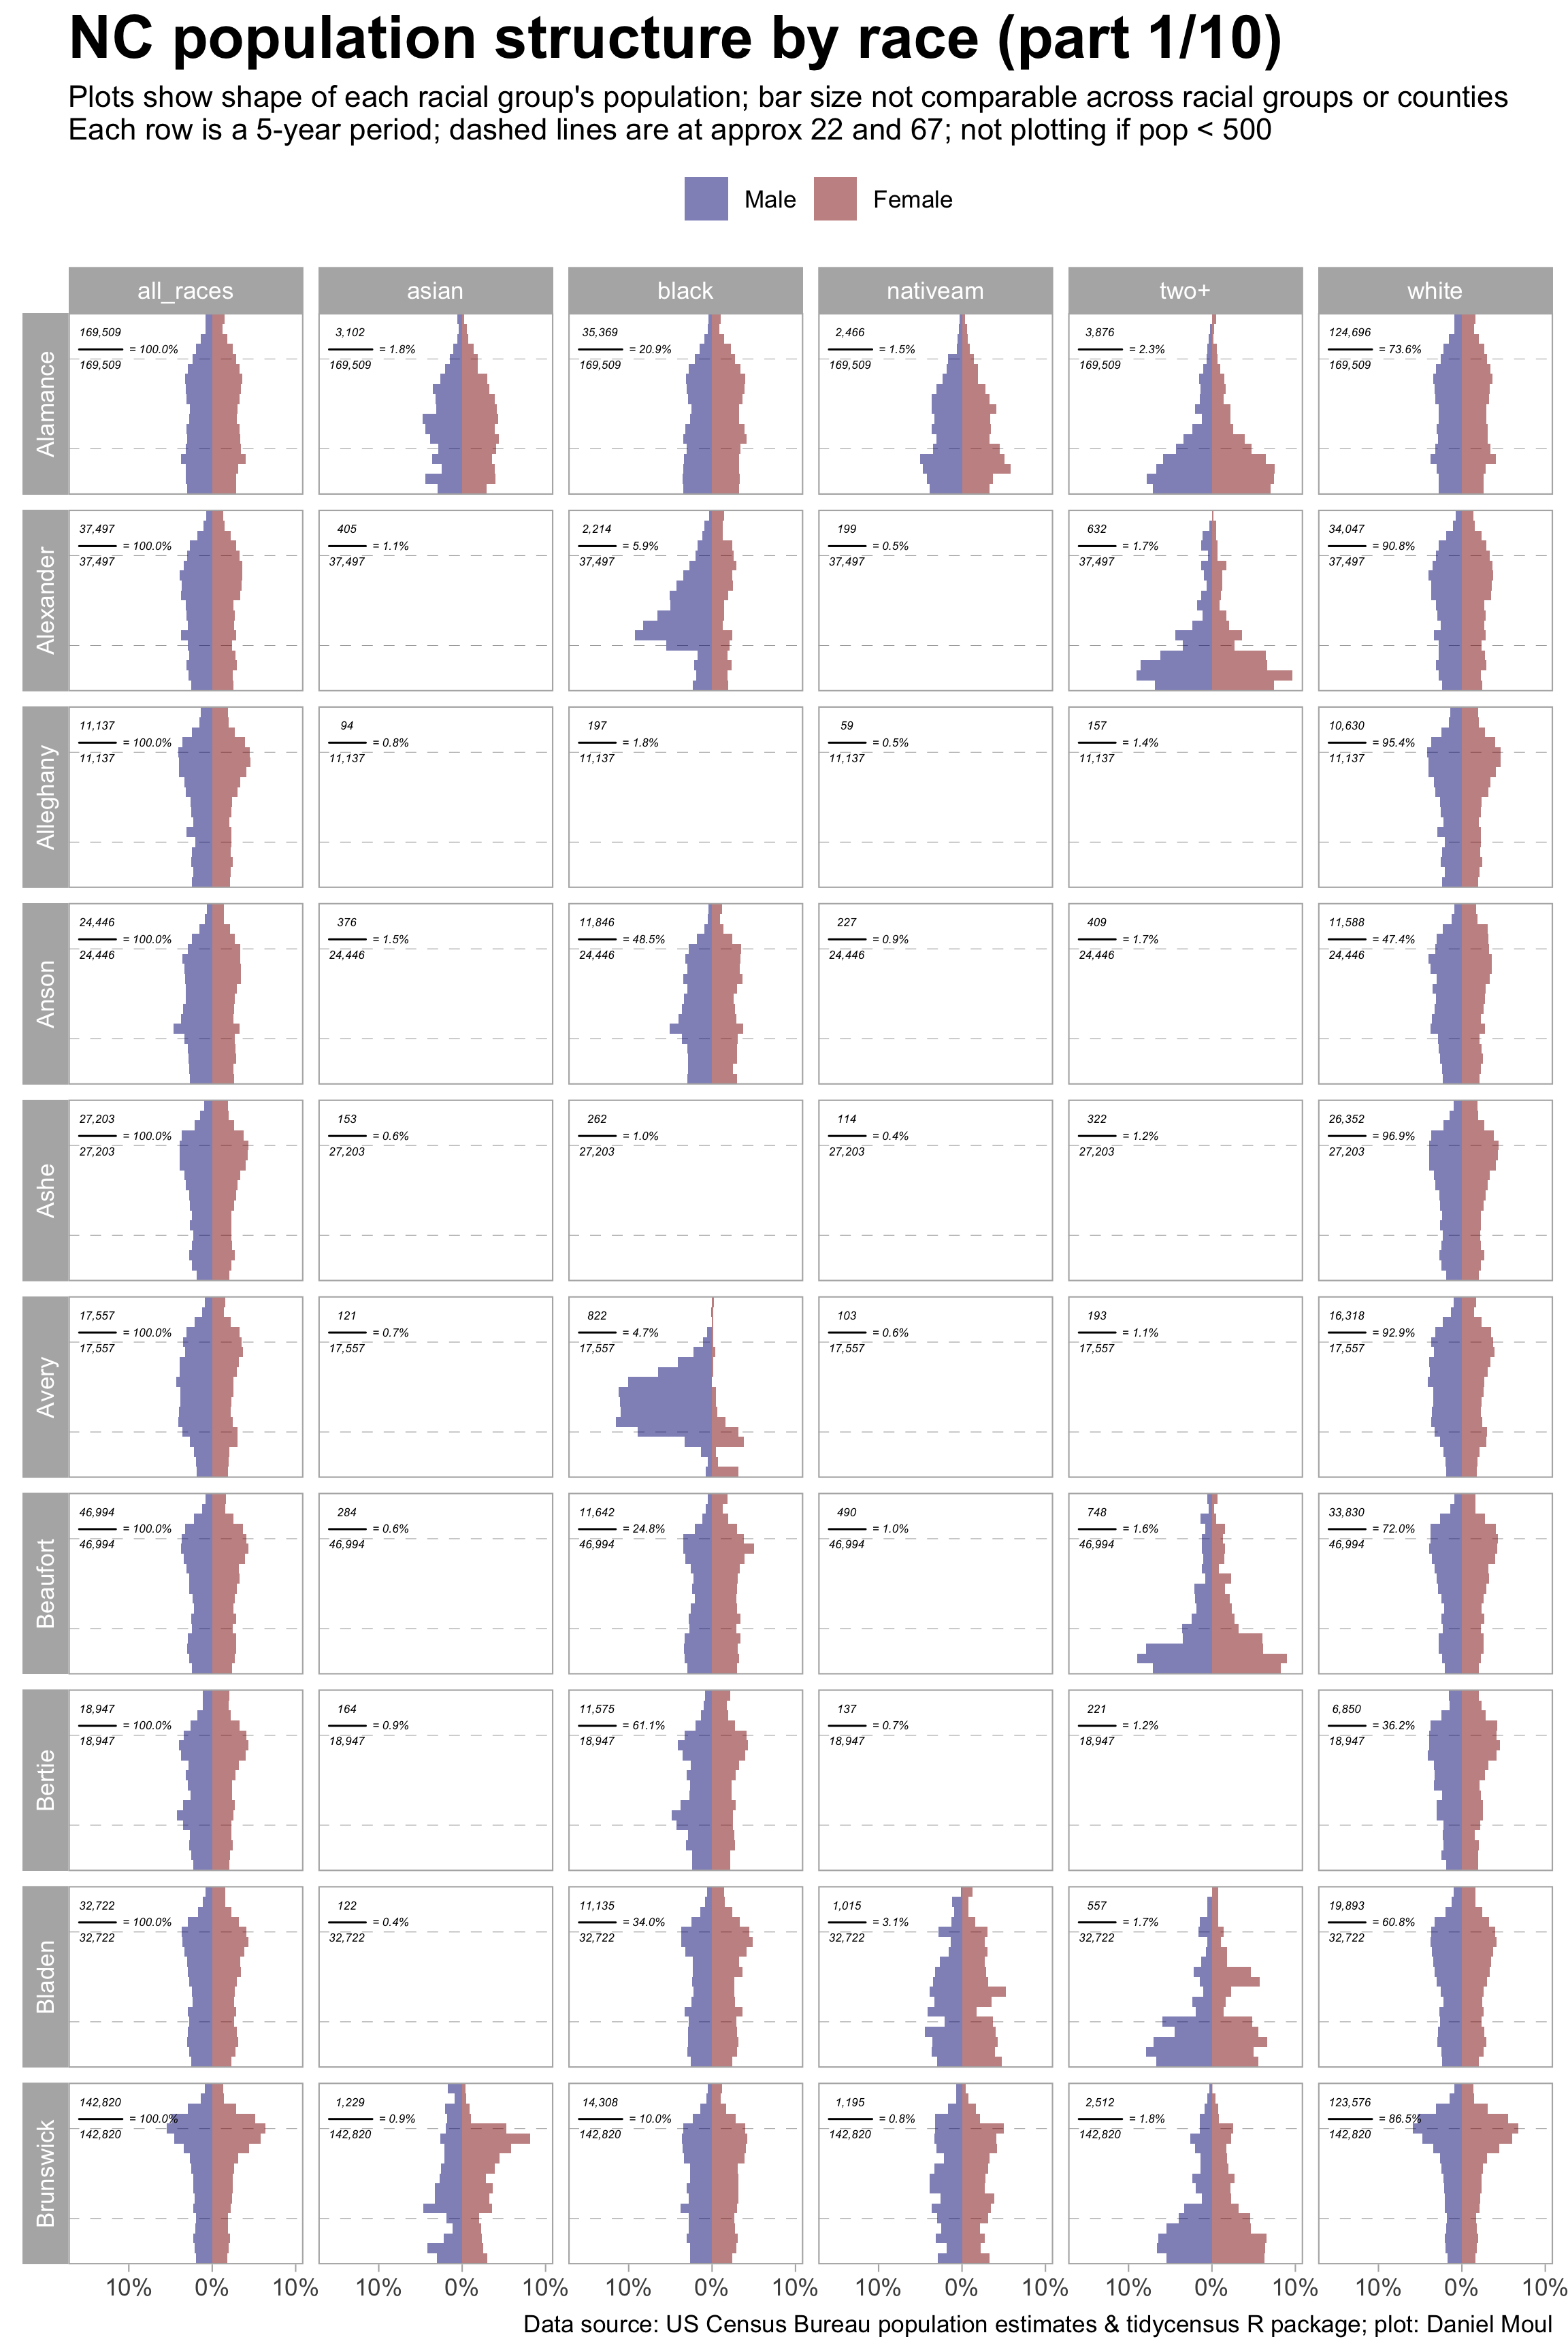
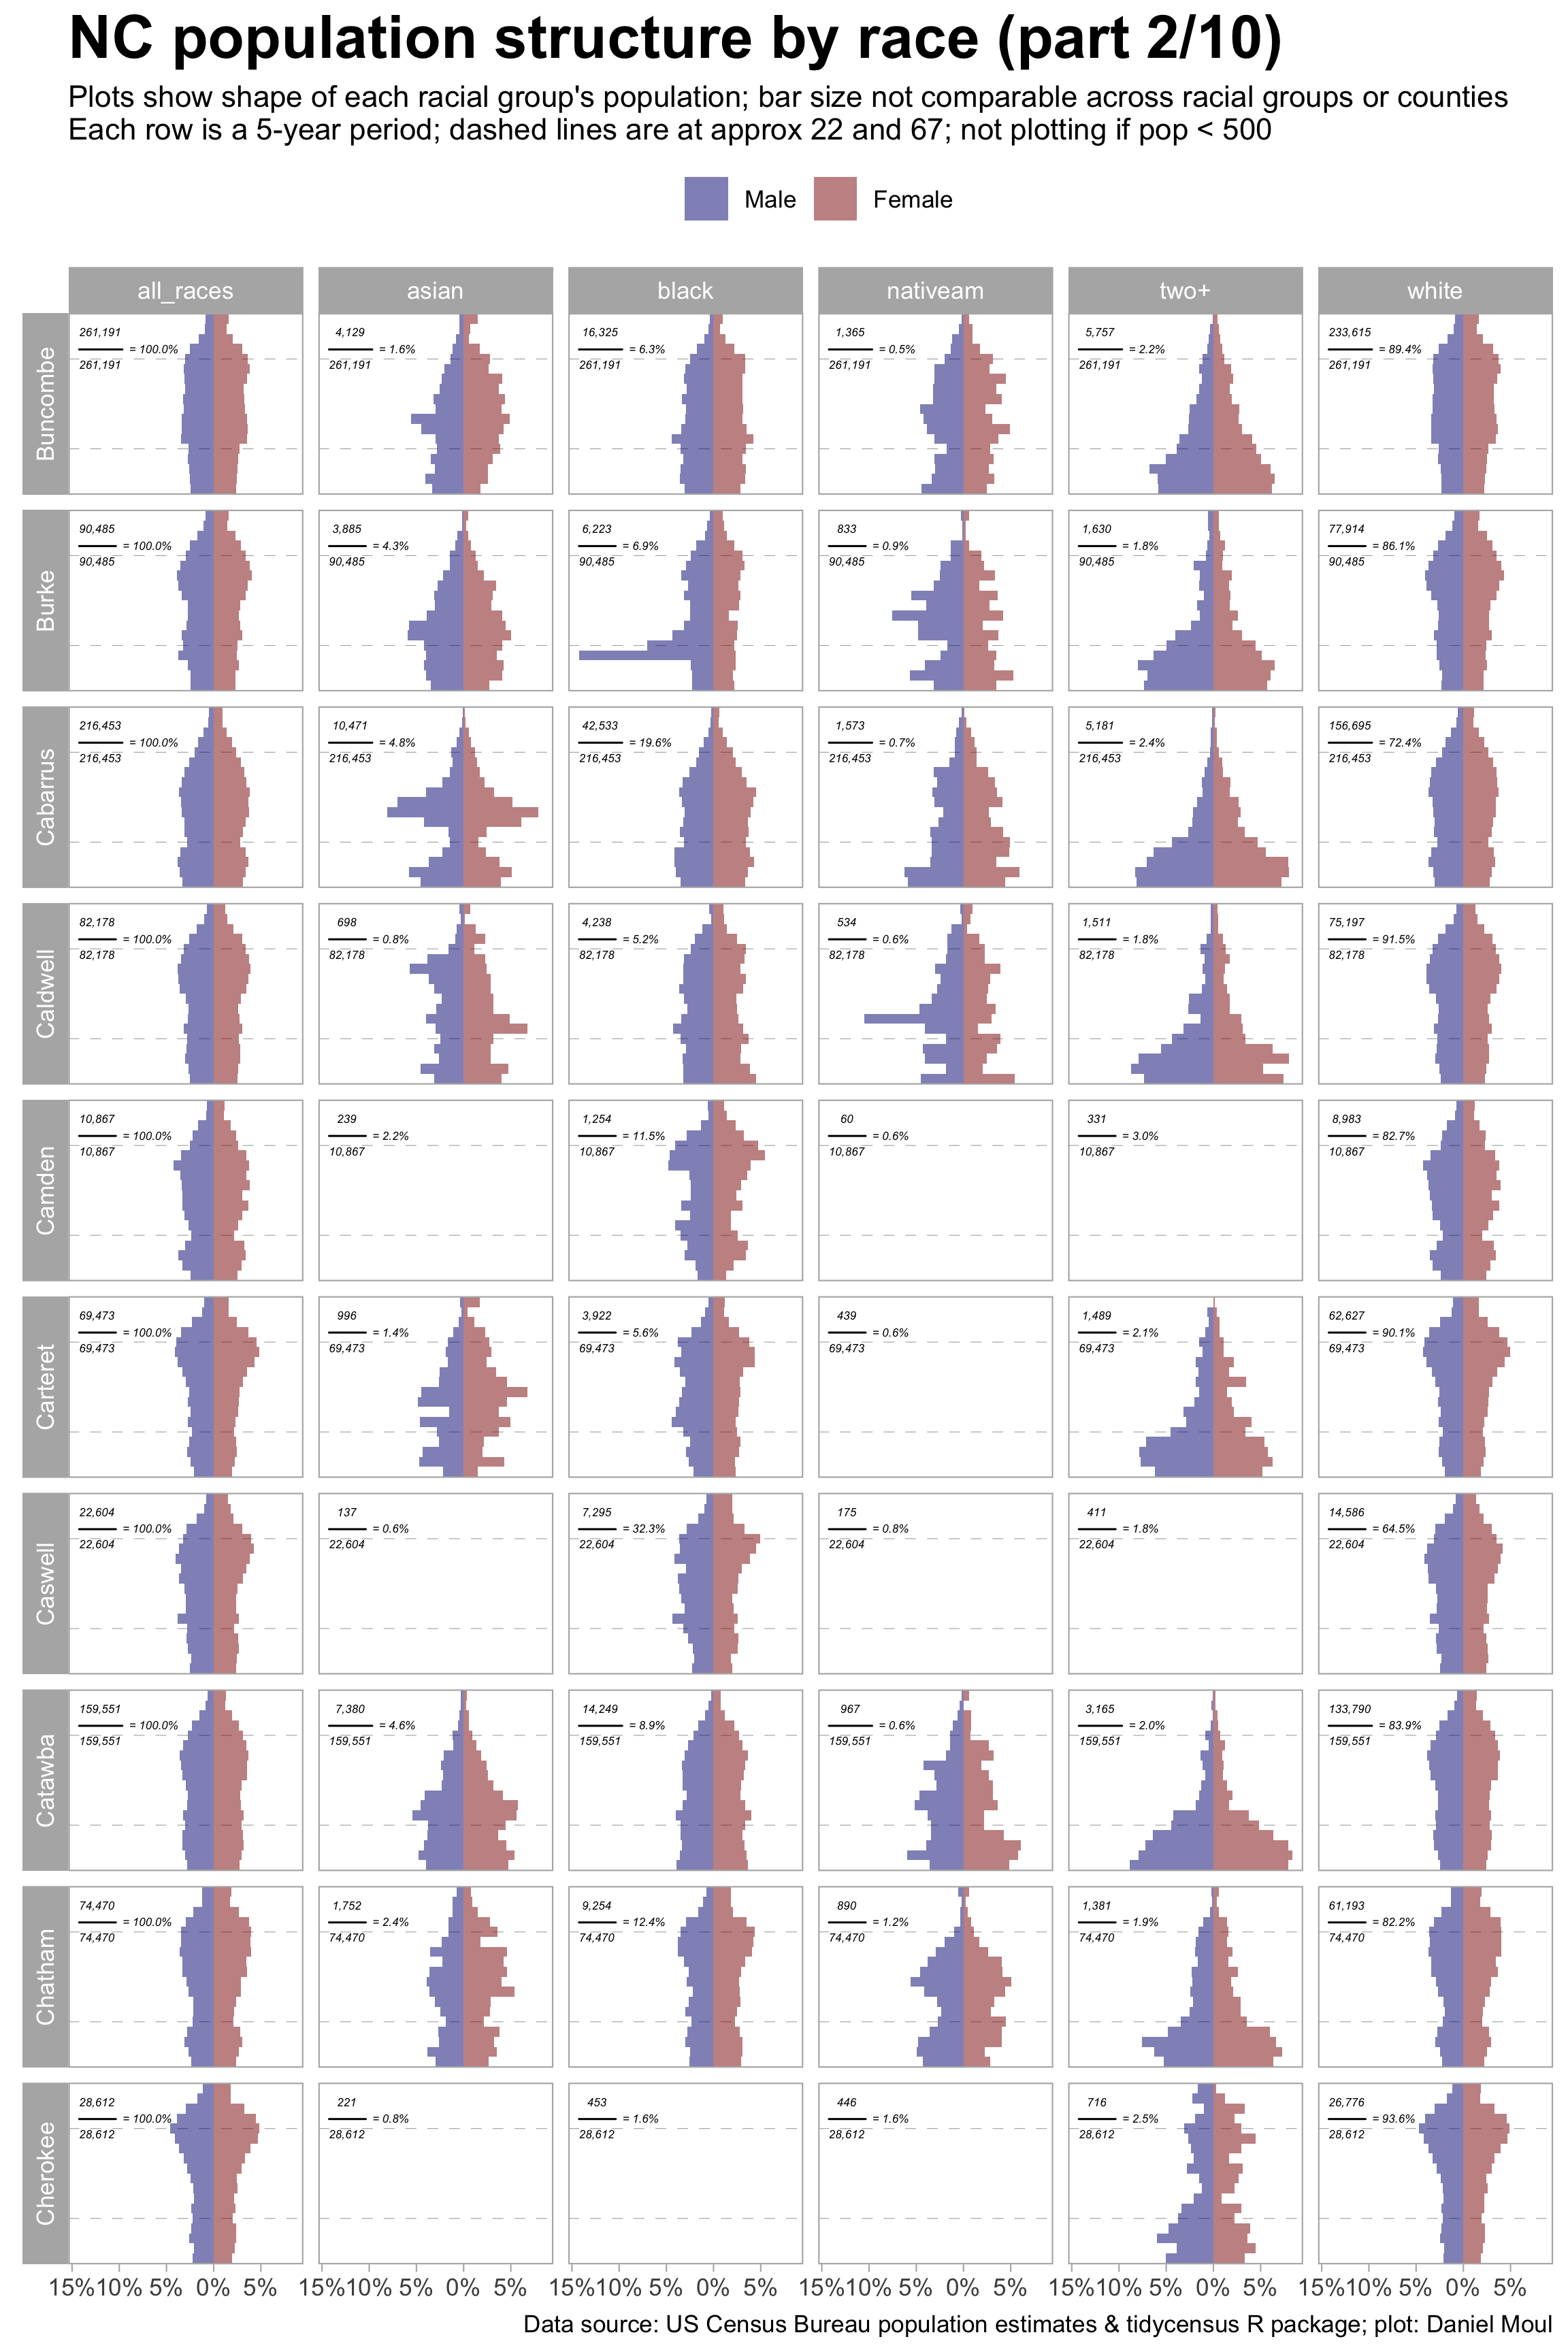
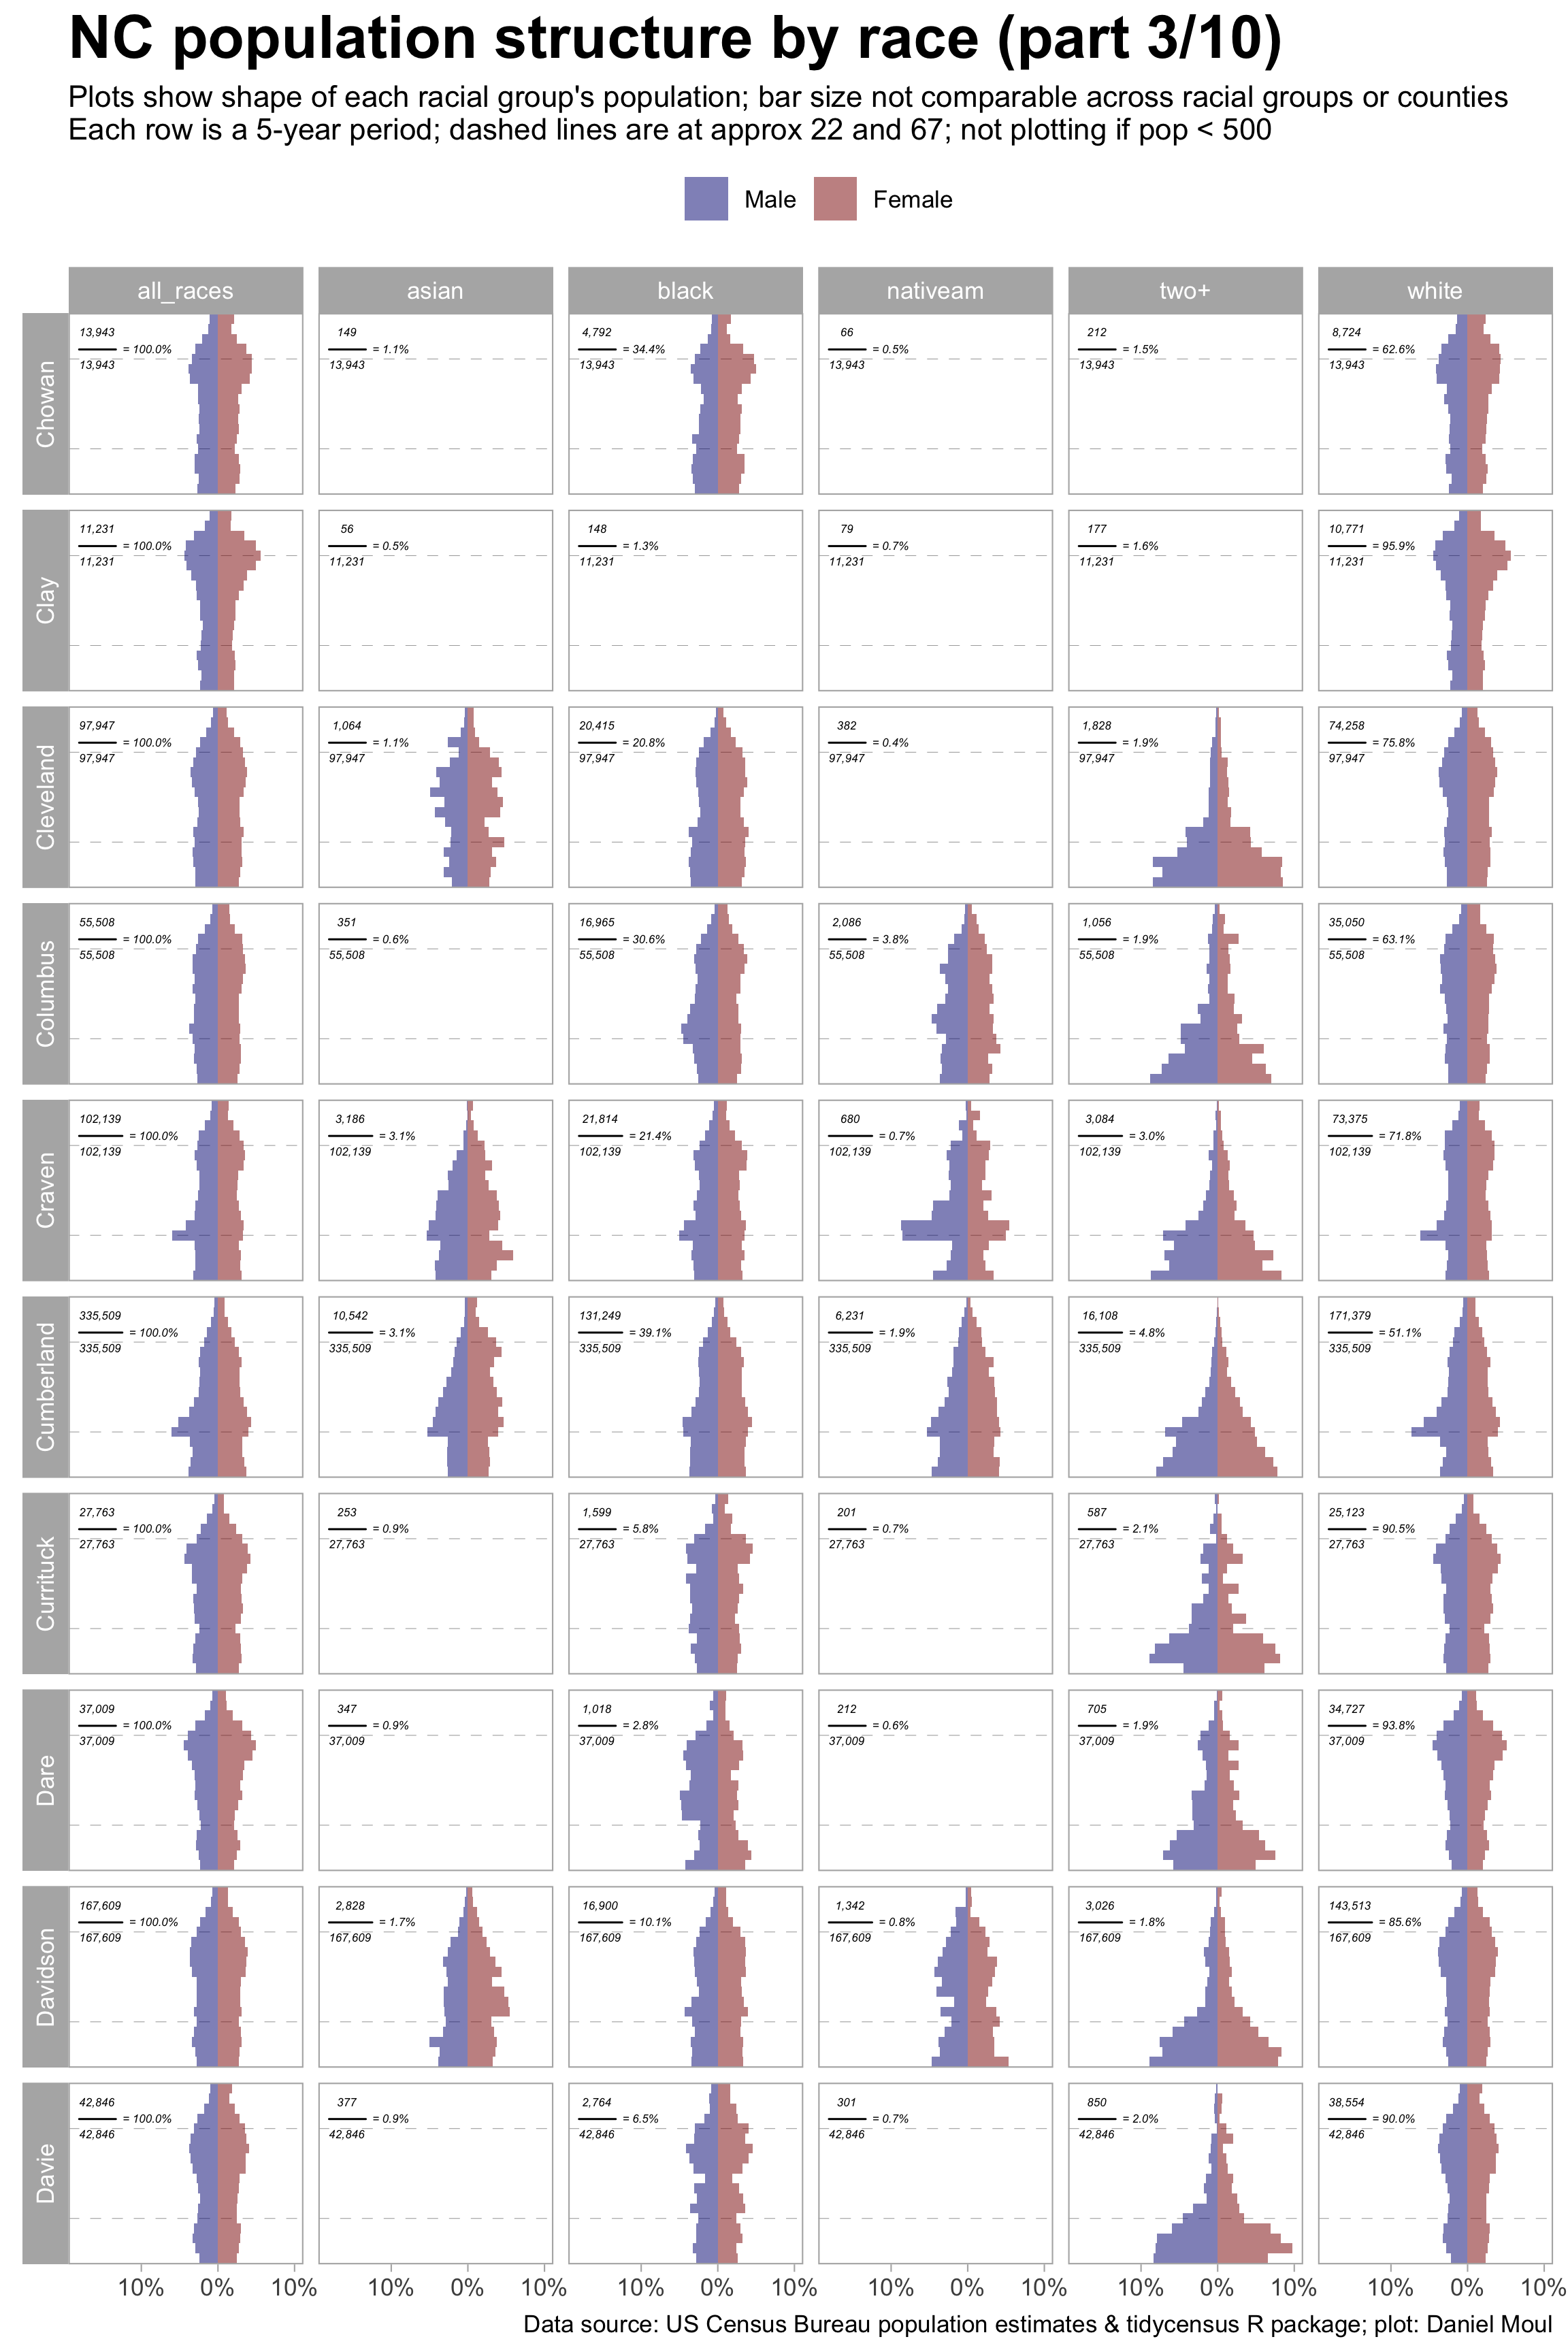
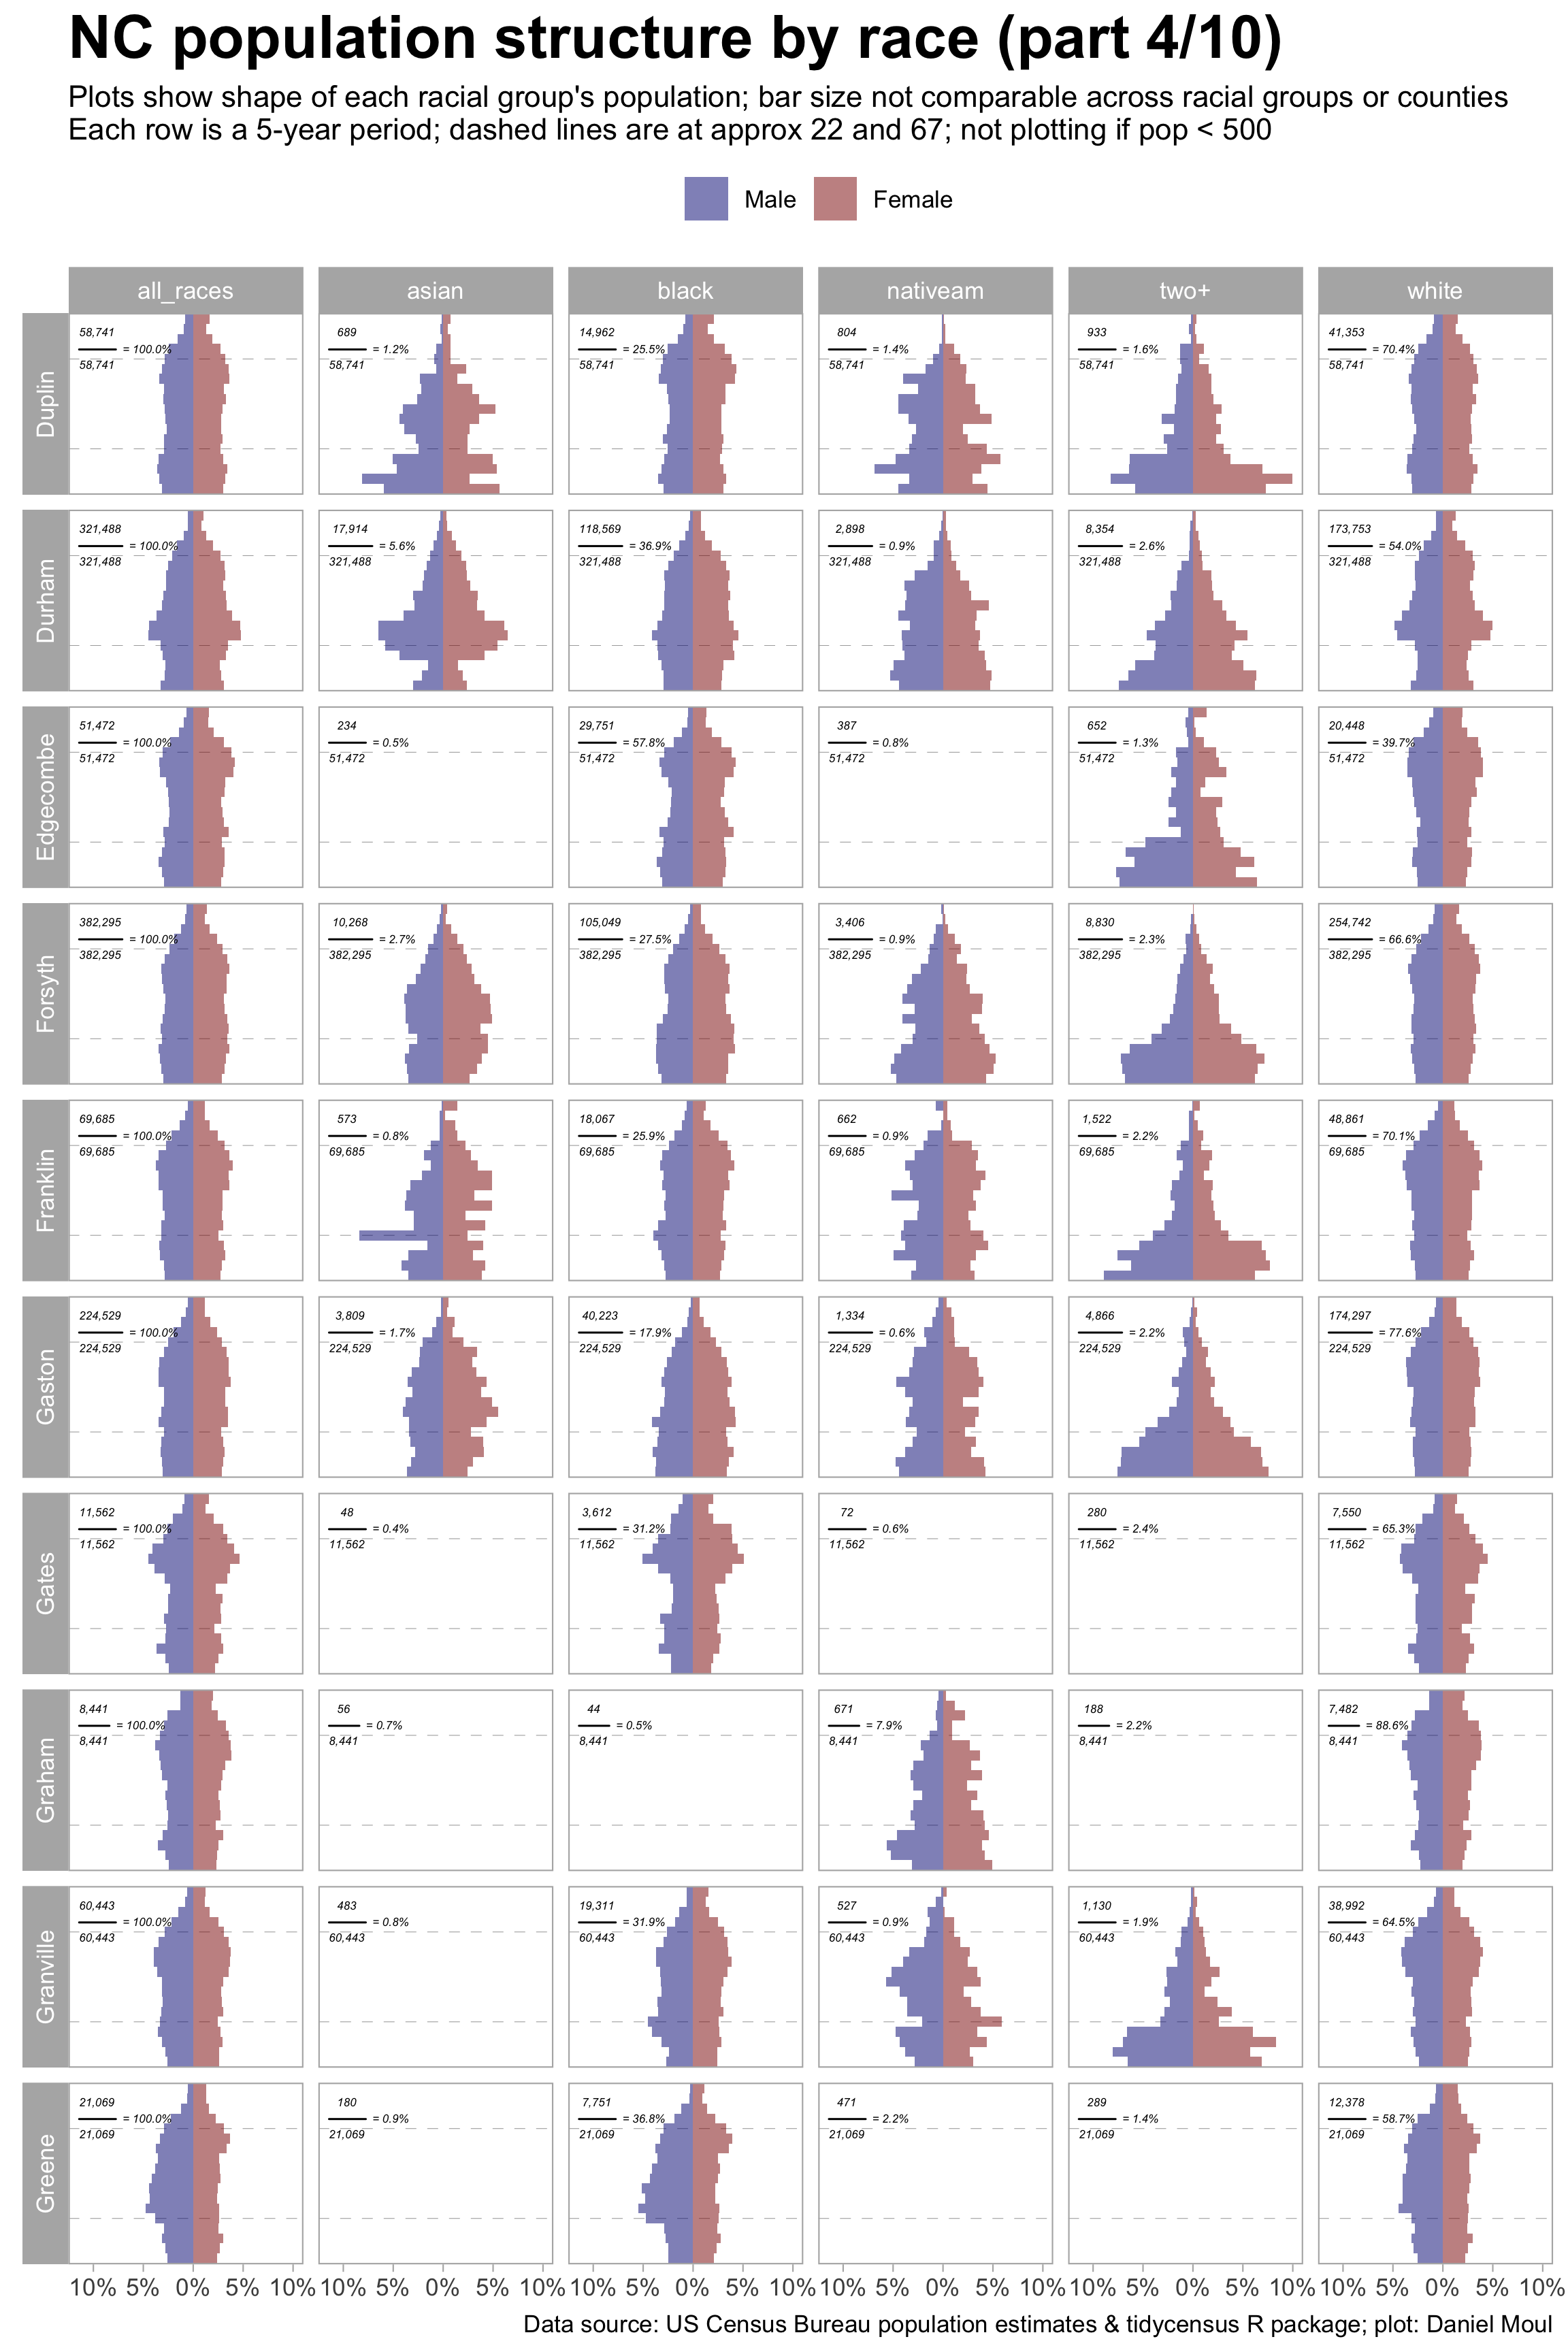
4 Population structure
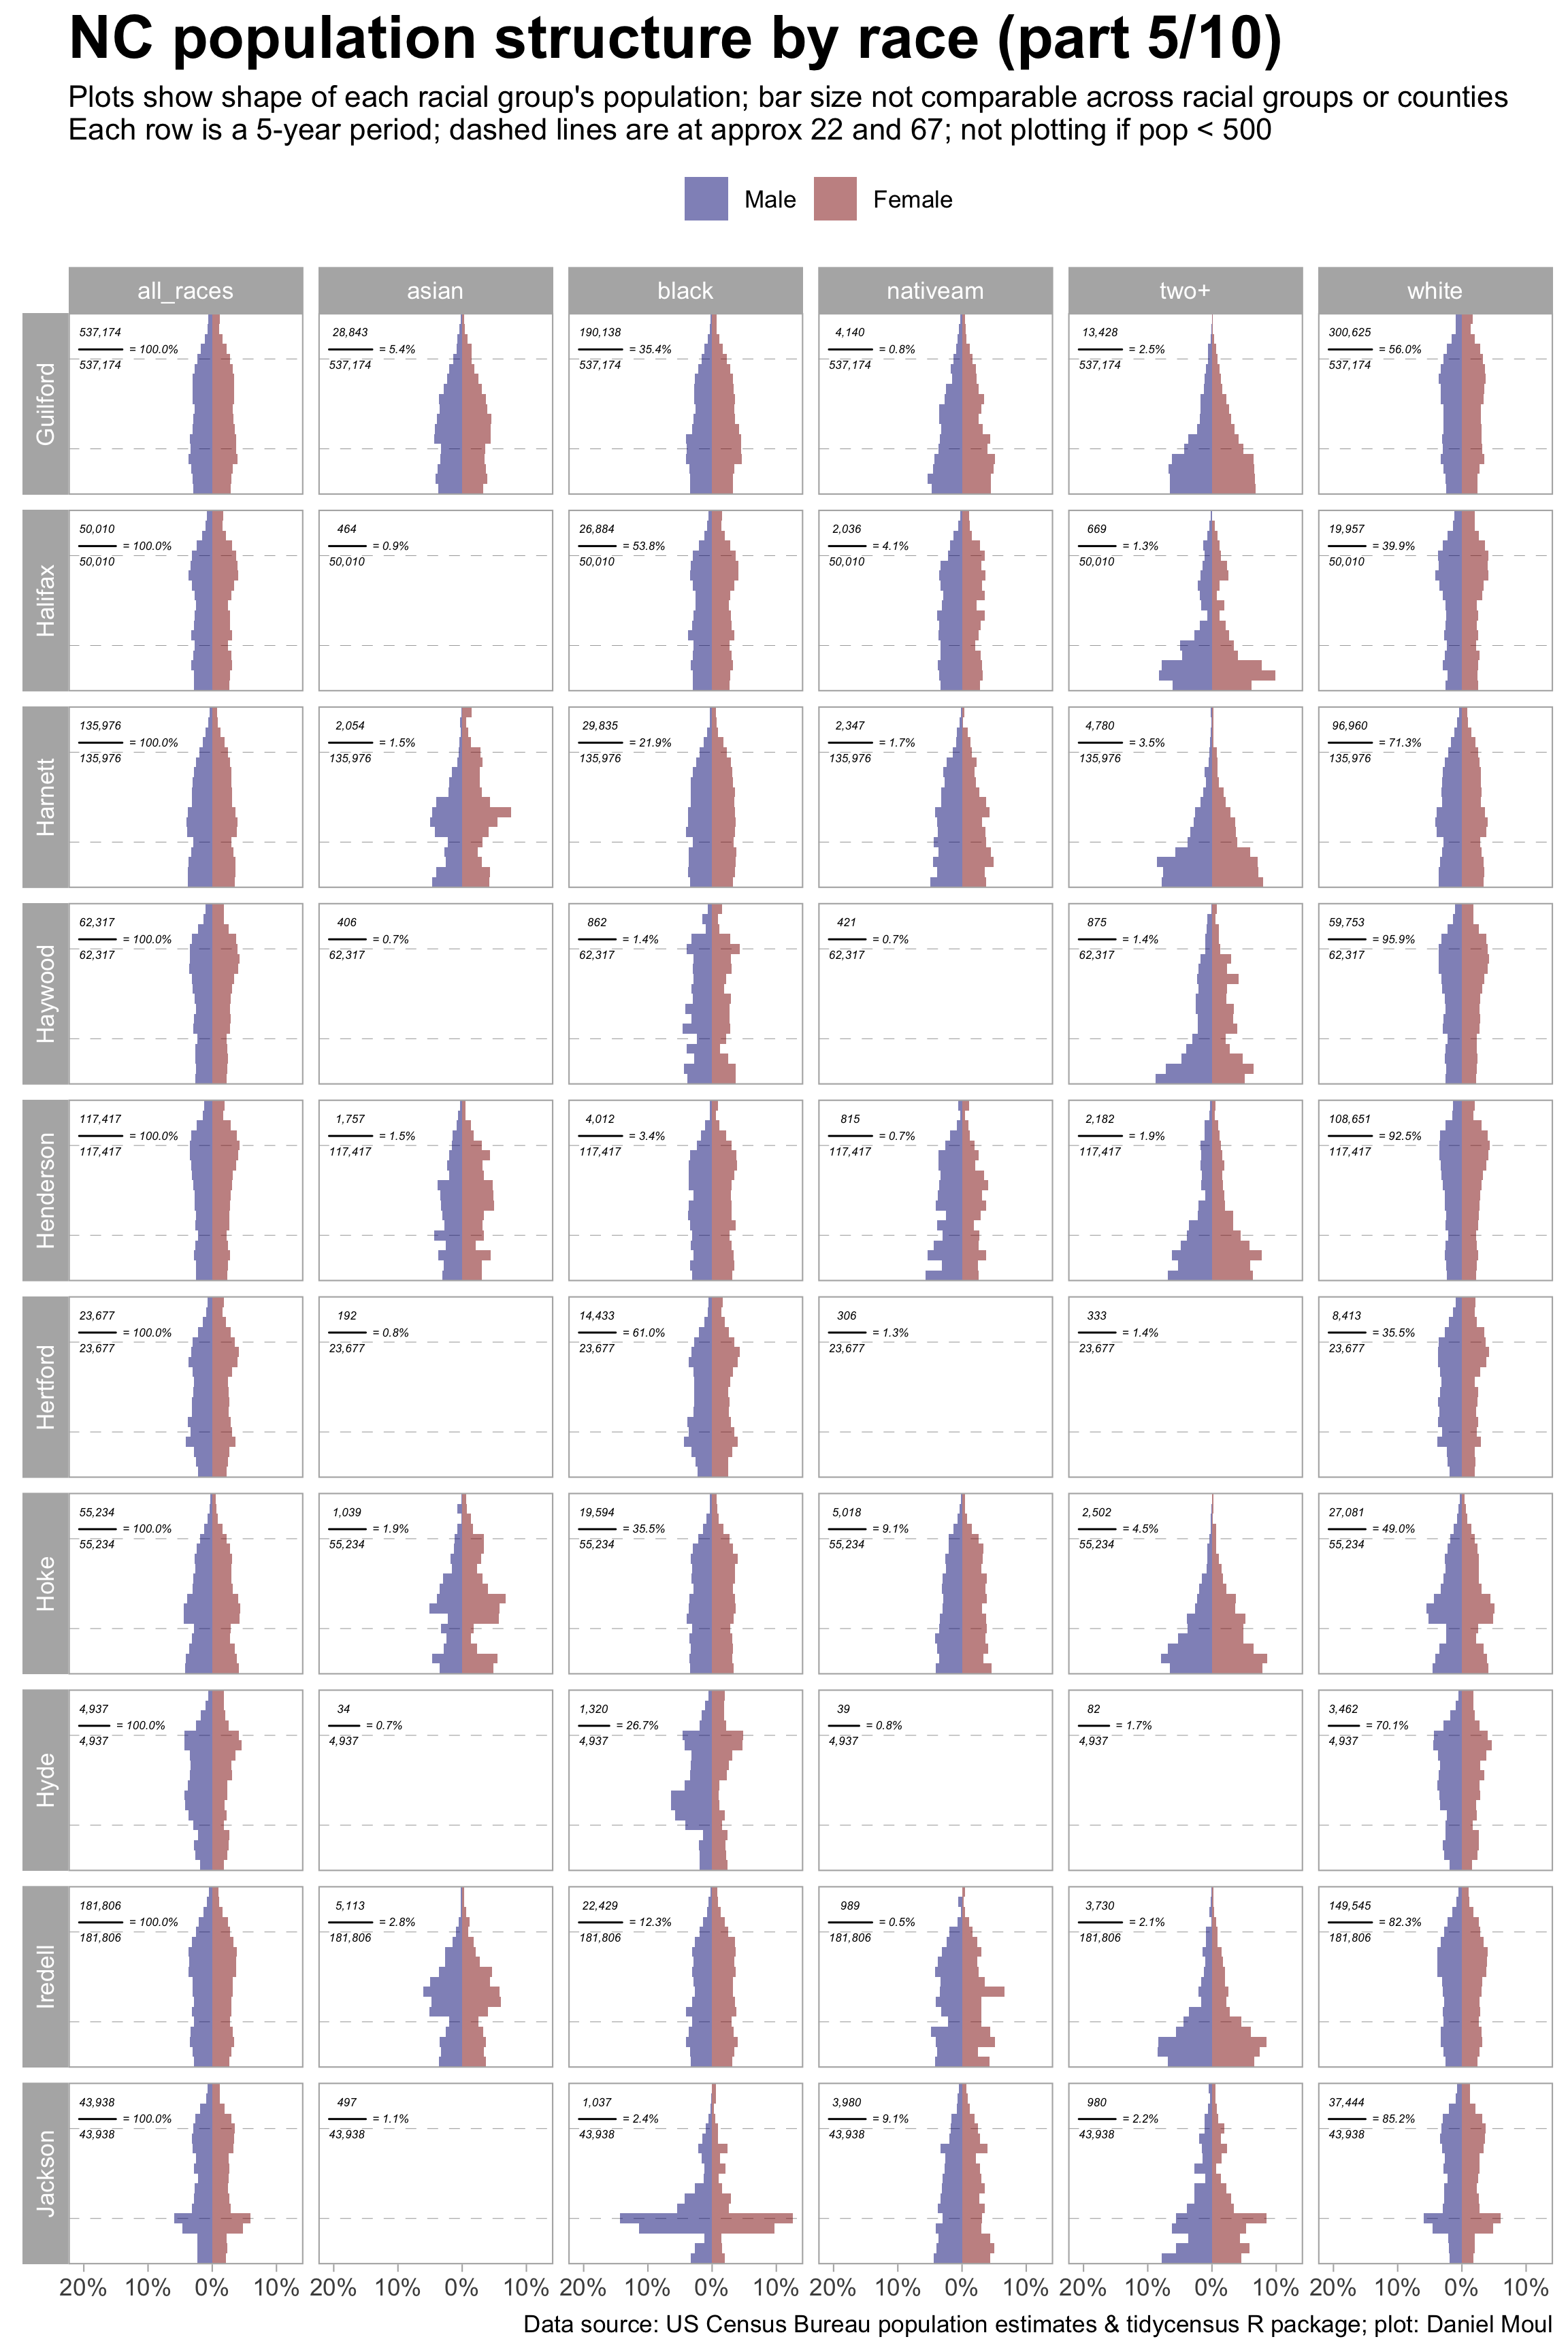
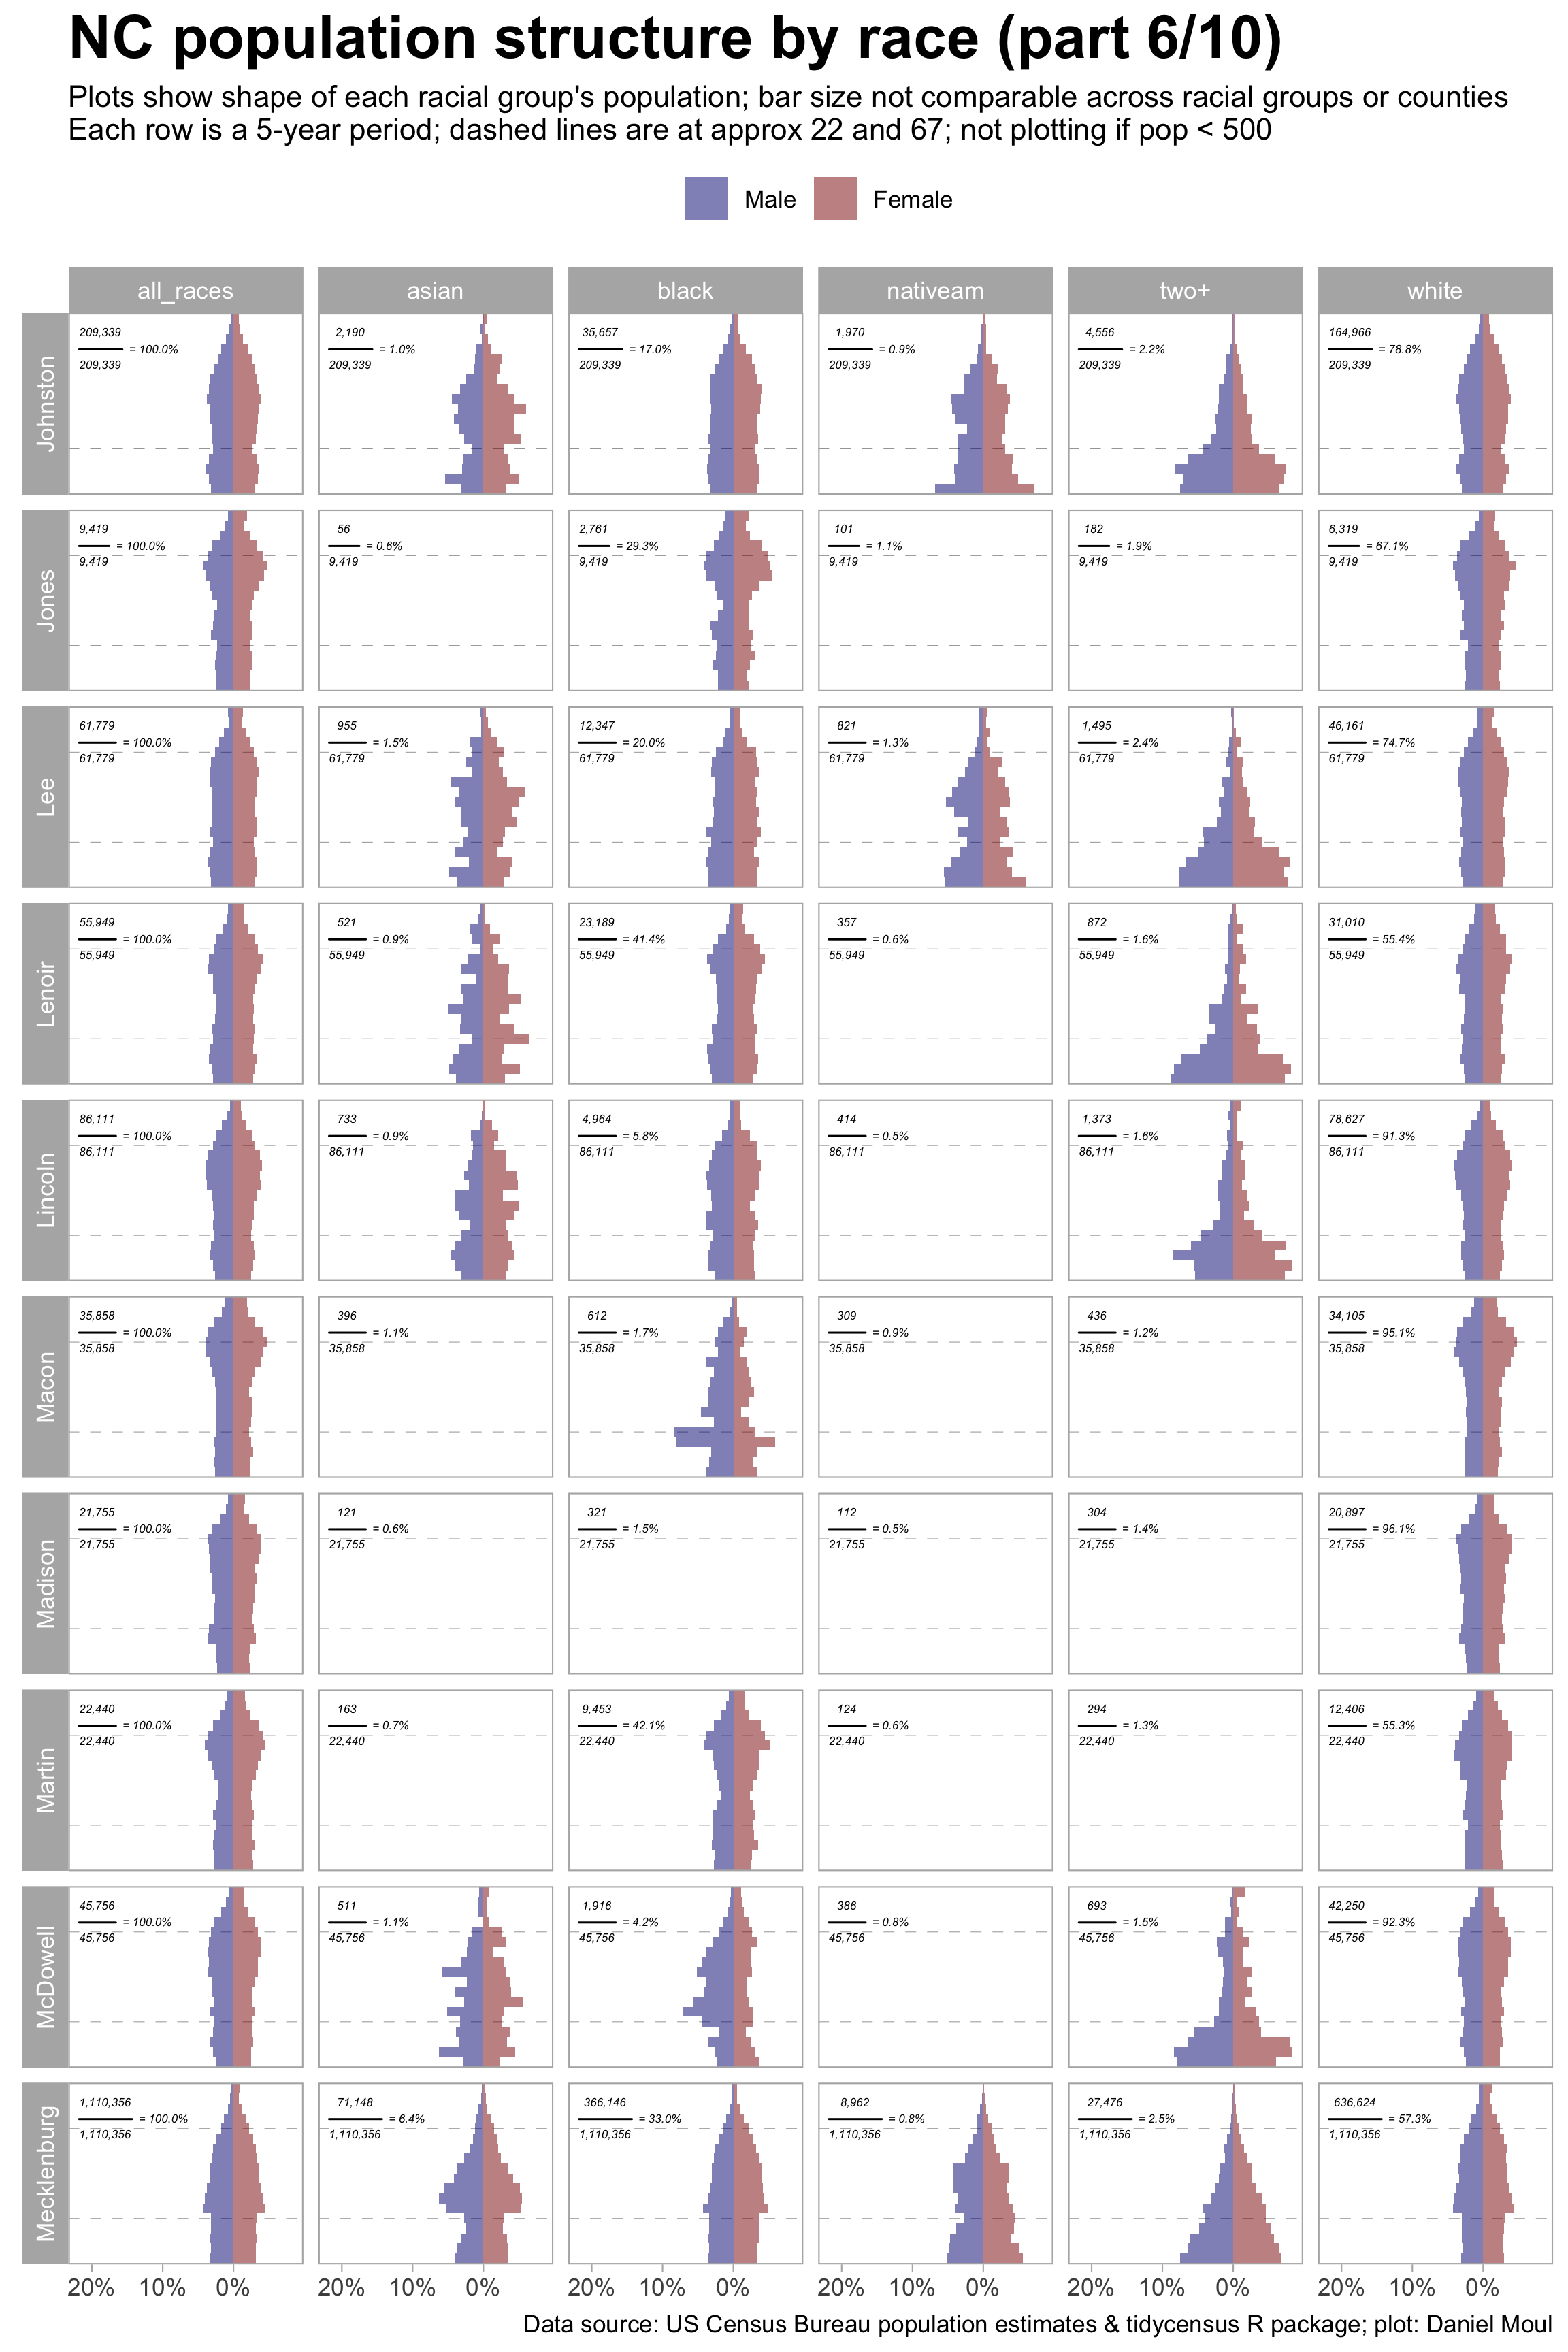
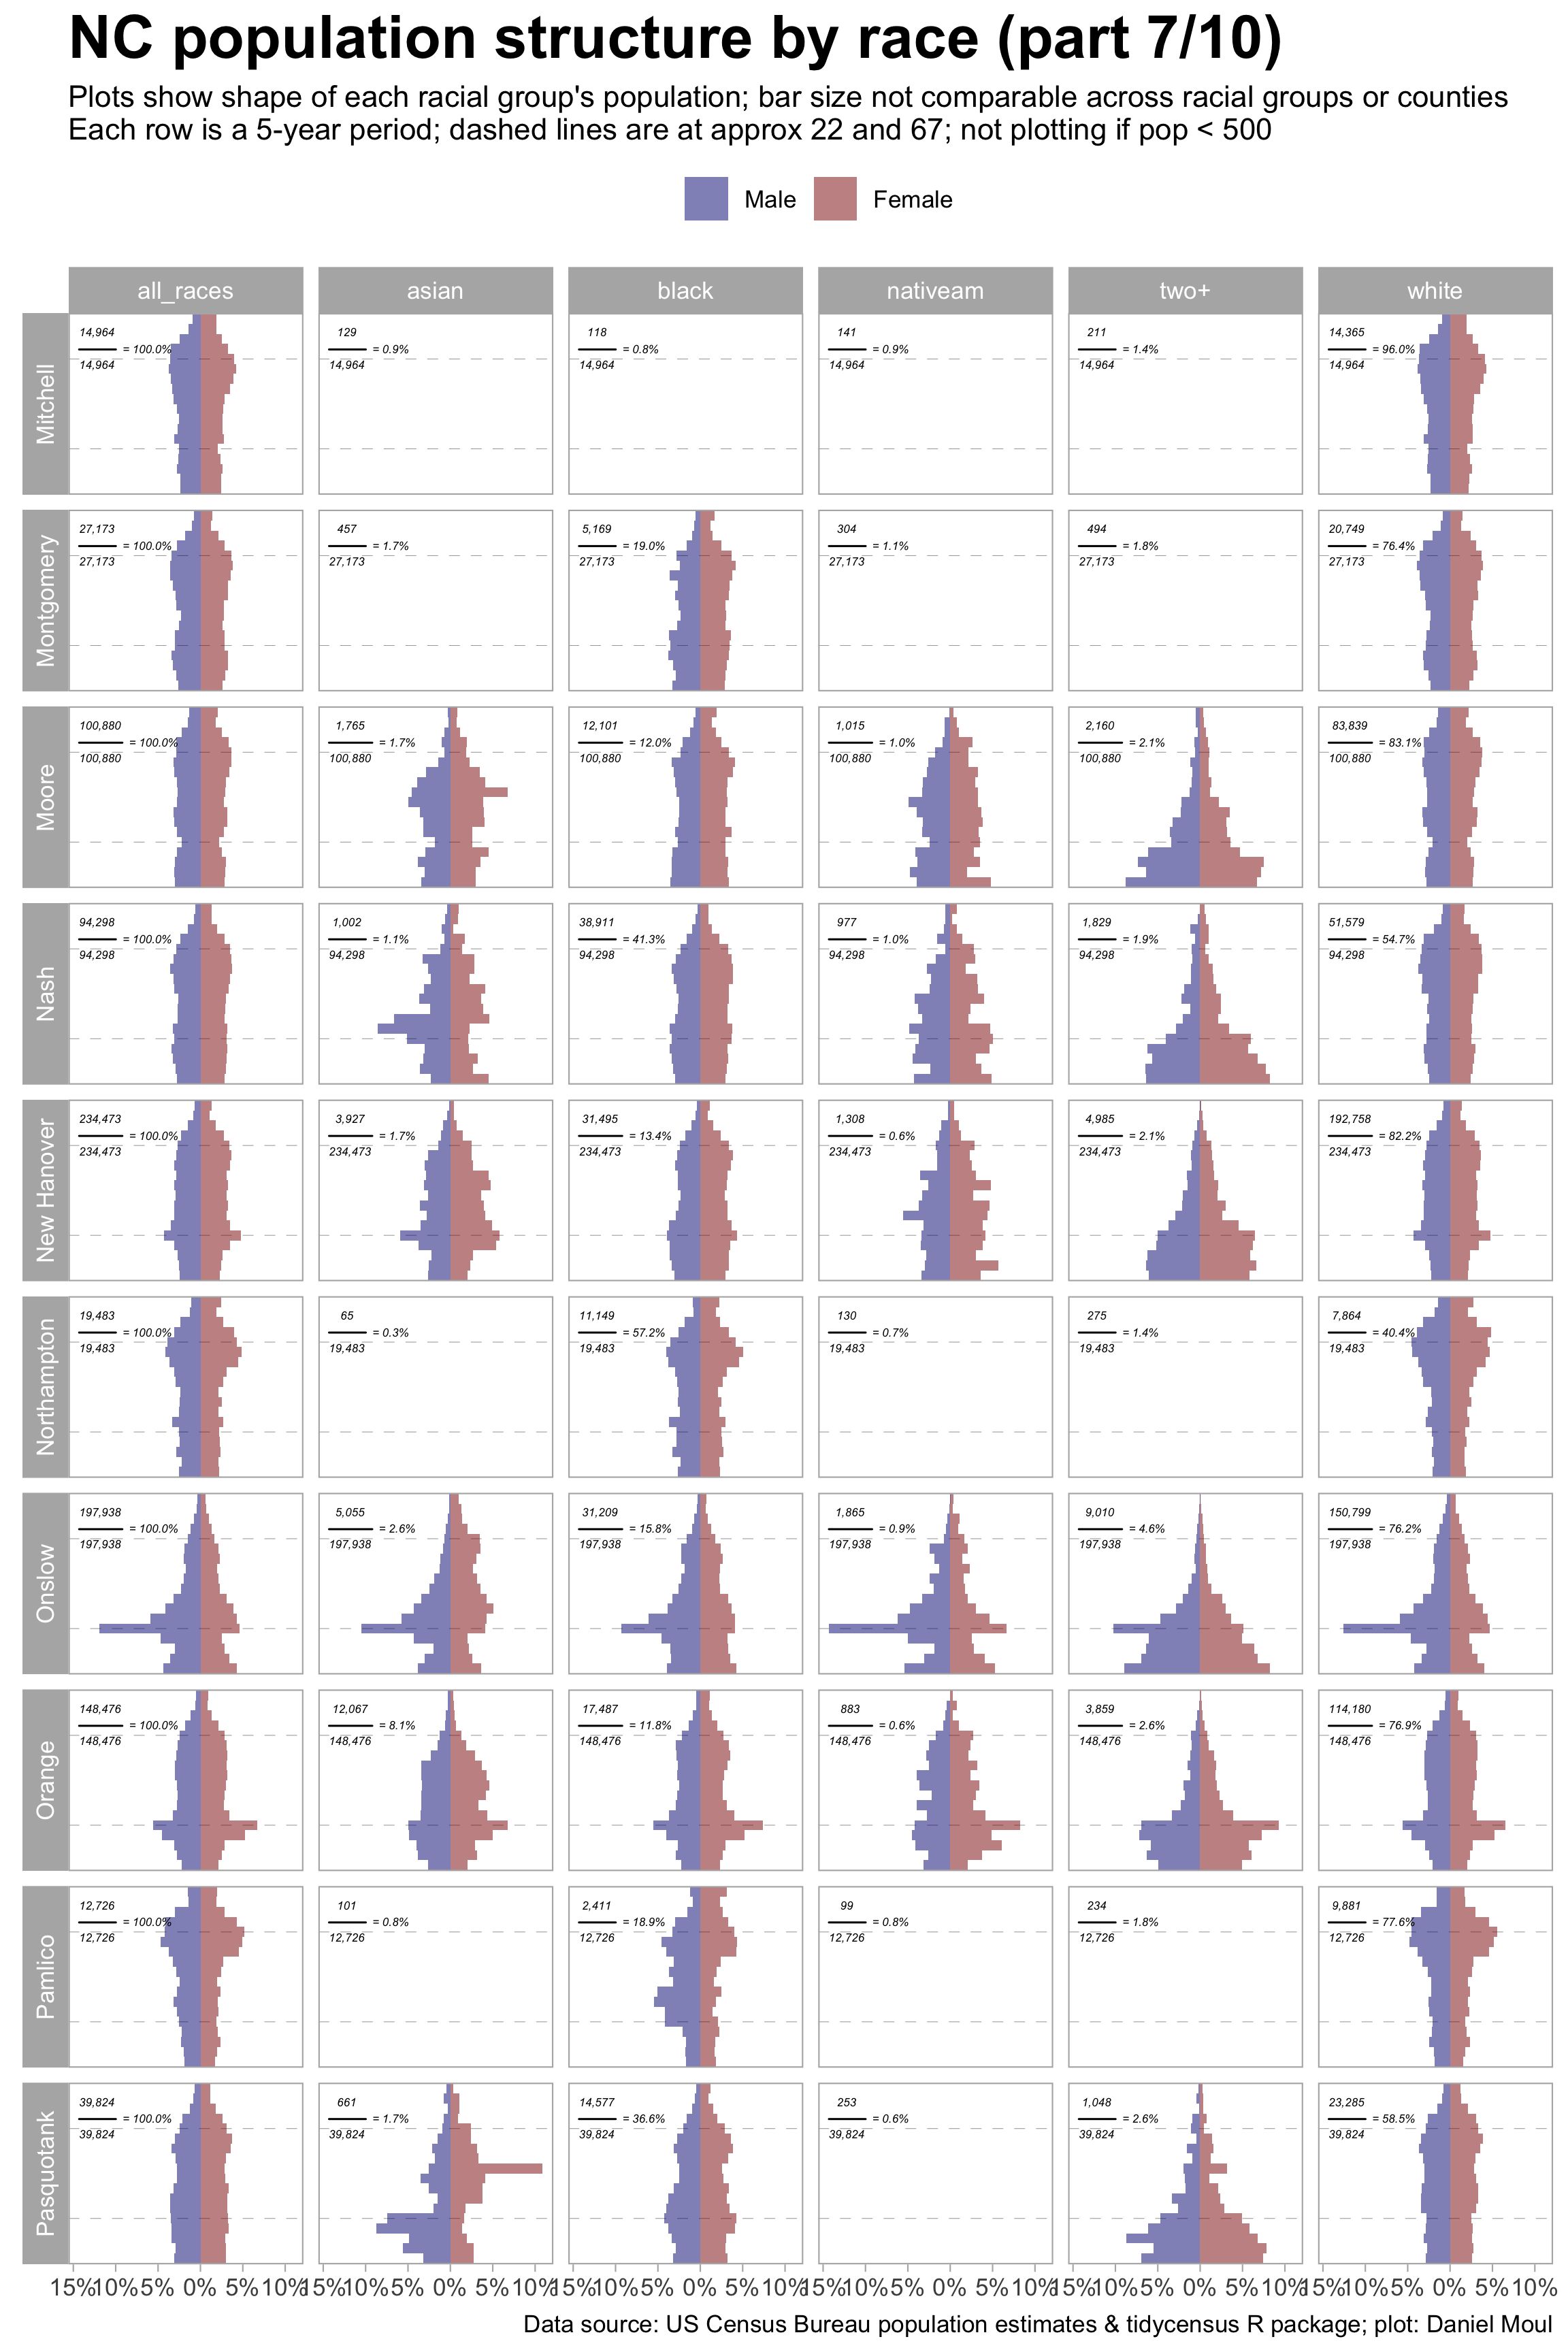
The age-sex distribution of a population, often represented in a population pyramid, is the result of historical and contemporary social, economic, and geographical factors. At the county level we can infer from population pyramids something of people’s differing priorities, needs, and patterns of behavior. For example, consider counties with relatively more retirees and near-retires (as in Figure 4.5 and Figure 4.6) compared to others with relatively more young people (as in Figure 4.7). In North Carolina there is a lot of variation in age-sex population structure across racial groups and counties. Differences invite use to ask “Why is this the case?” and then make inferences as we try to answer.
The tidycensus package offers the following helpful warning when returning results from 2020, which is relevant to this endeavor:
2020 decennial Census data use differential privacy, a technique that introduces errors into data to preserve respondent confidentiality. Small counts should be interpreted with caution. See https://www.census.gov/library/fact-sheets/2021/protecting-the-confidentiality-of-the-2020-census-redistricting-data.html for additional guidance.
4.1 NC population structure
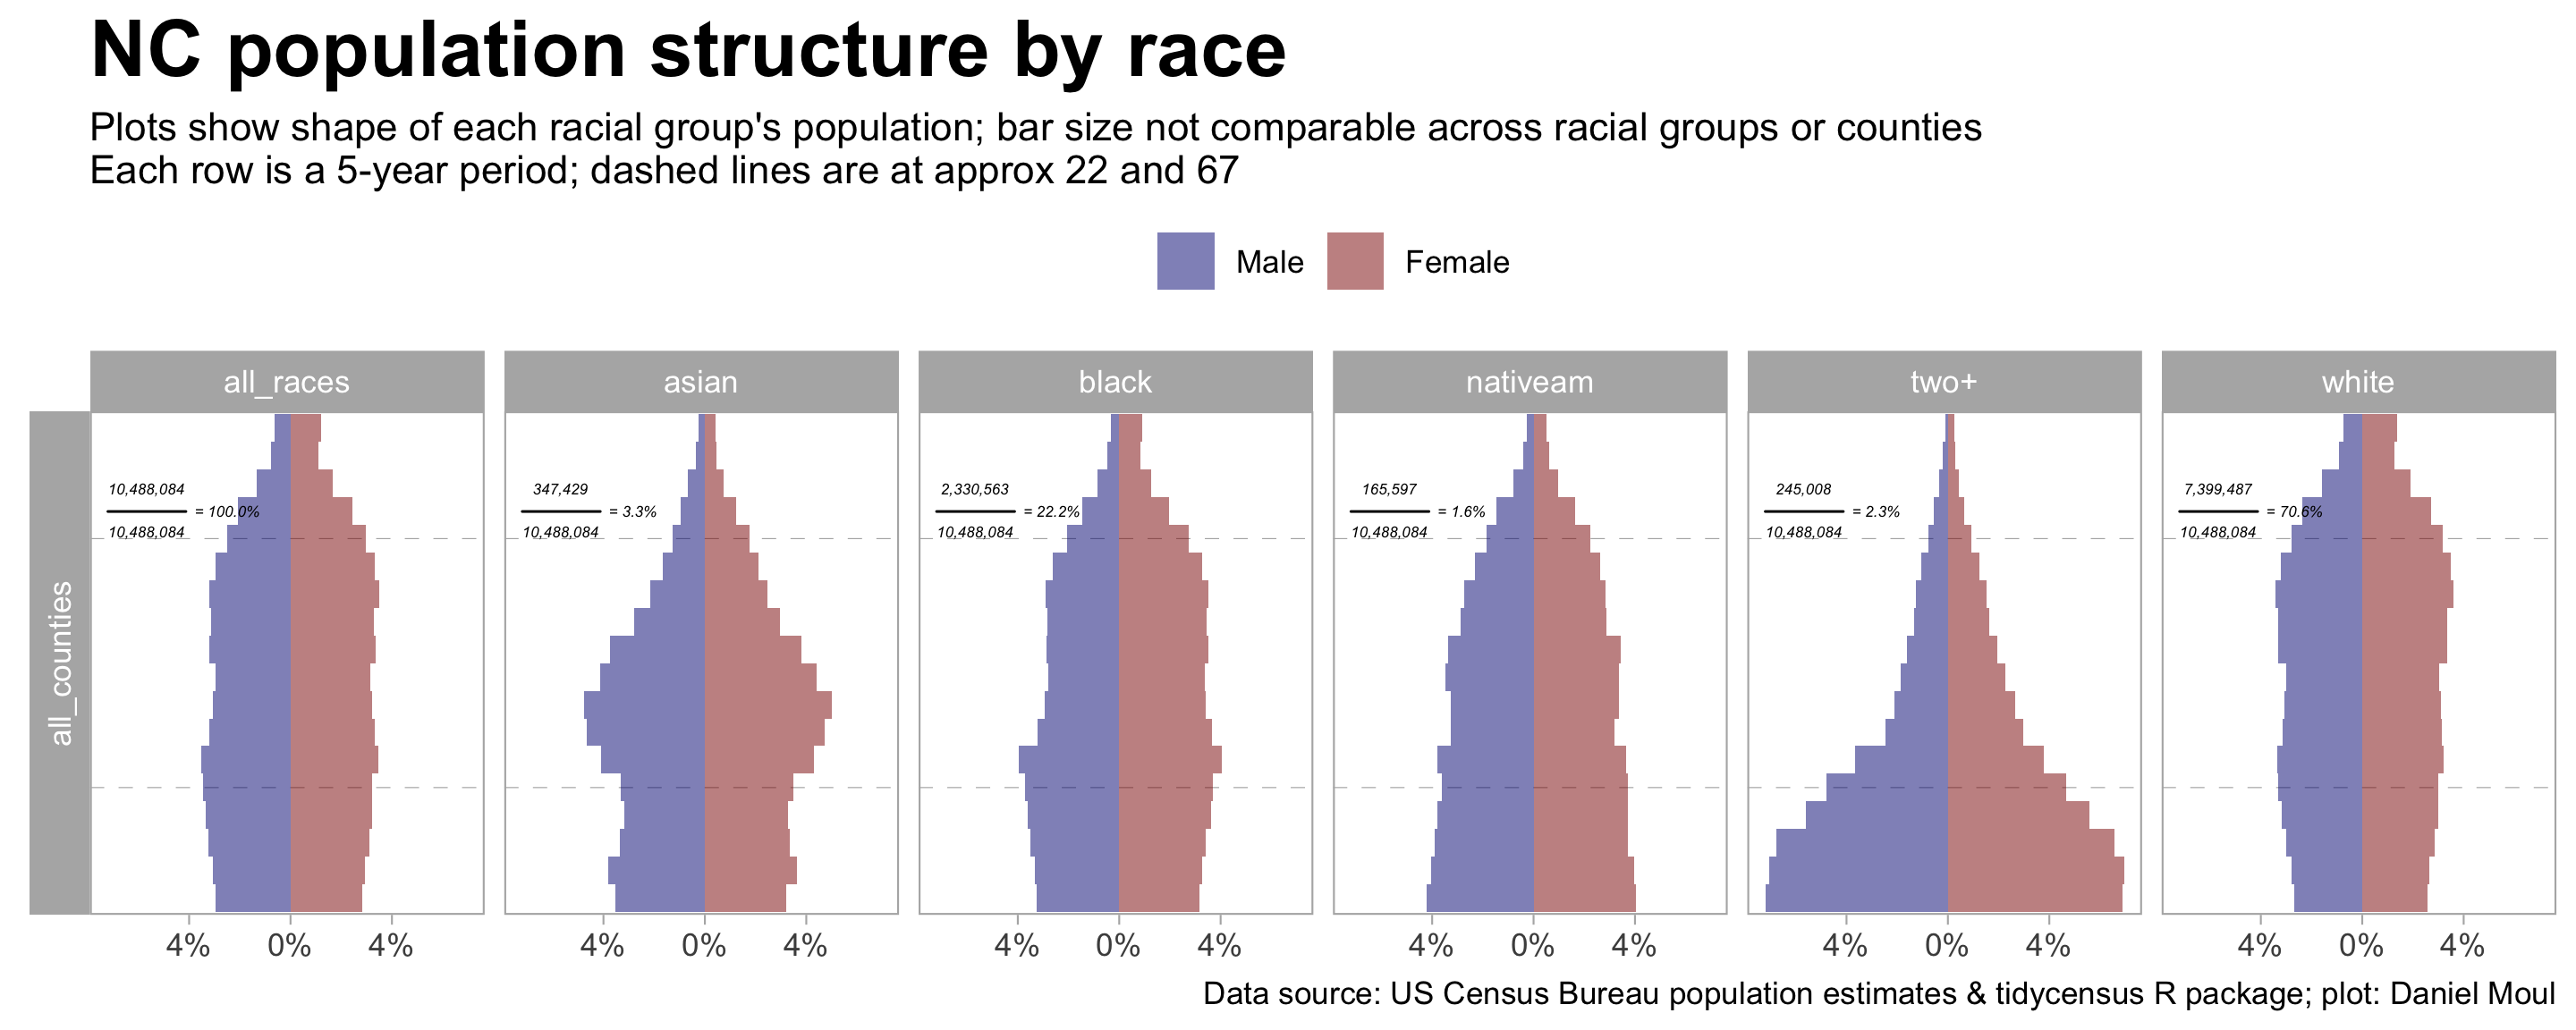
The population distributions of racial groups for the whole of North Carolina vary quite considerably.
Since blacks and whites make up about 93% of the state population, the “all_races” distribution looks a lot like the ones for these groups. The shape indicates populations that are modestly declining.
The Asian distribution bulges in the late twenties through early forties, consistent with immigrant communities that are recent or don’t have large families.
The Native American distribution shows on-going modest growth.
The “two or more races” distribution is most striking: a large, bottom-heavy pyramid indicates a very youthful, growing population.
How to interpret these plots
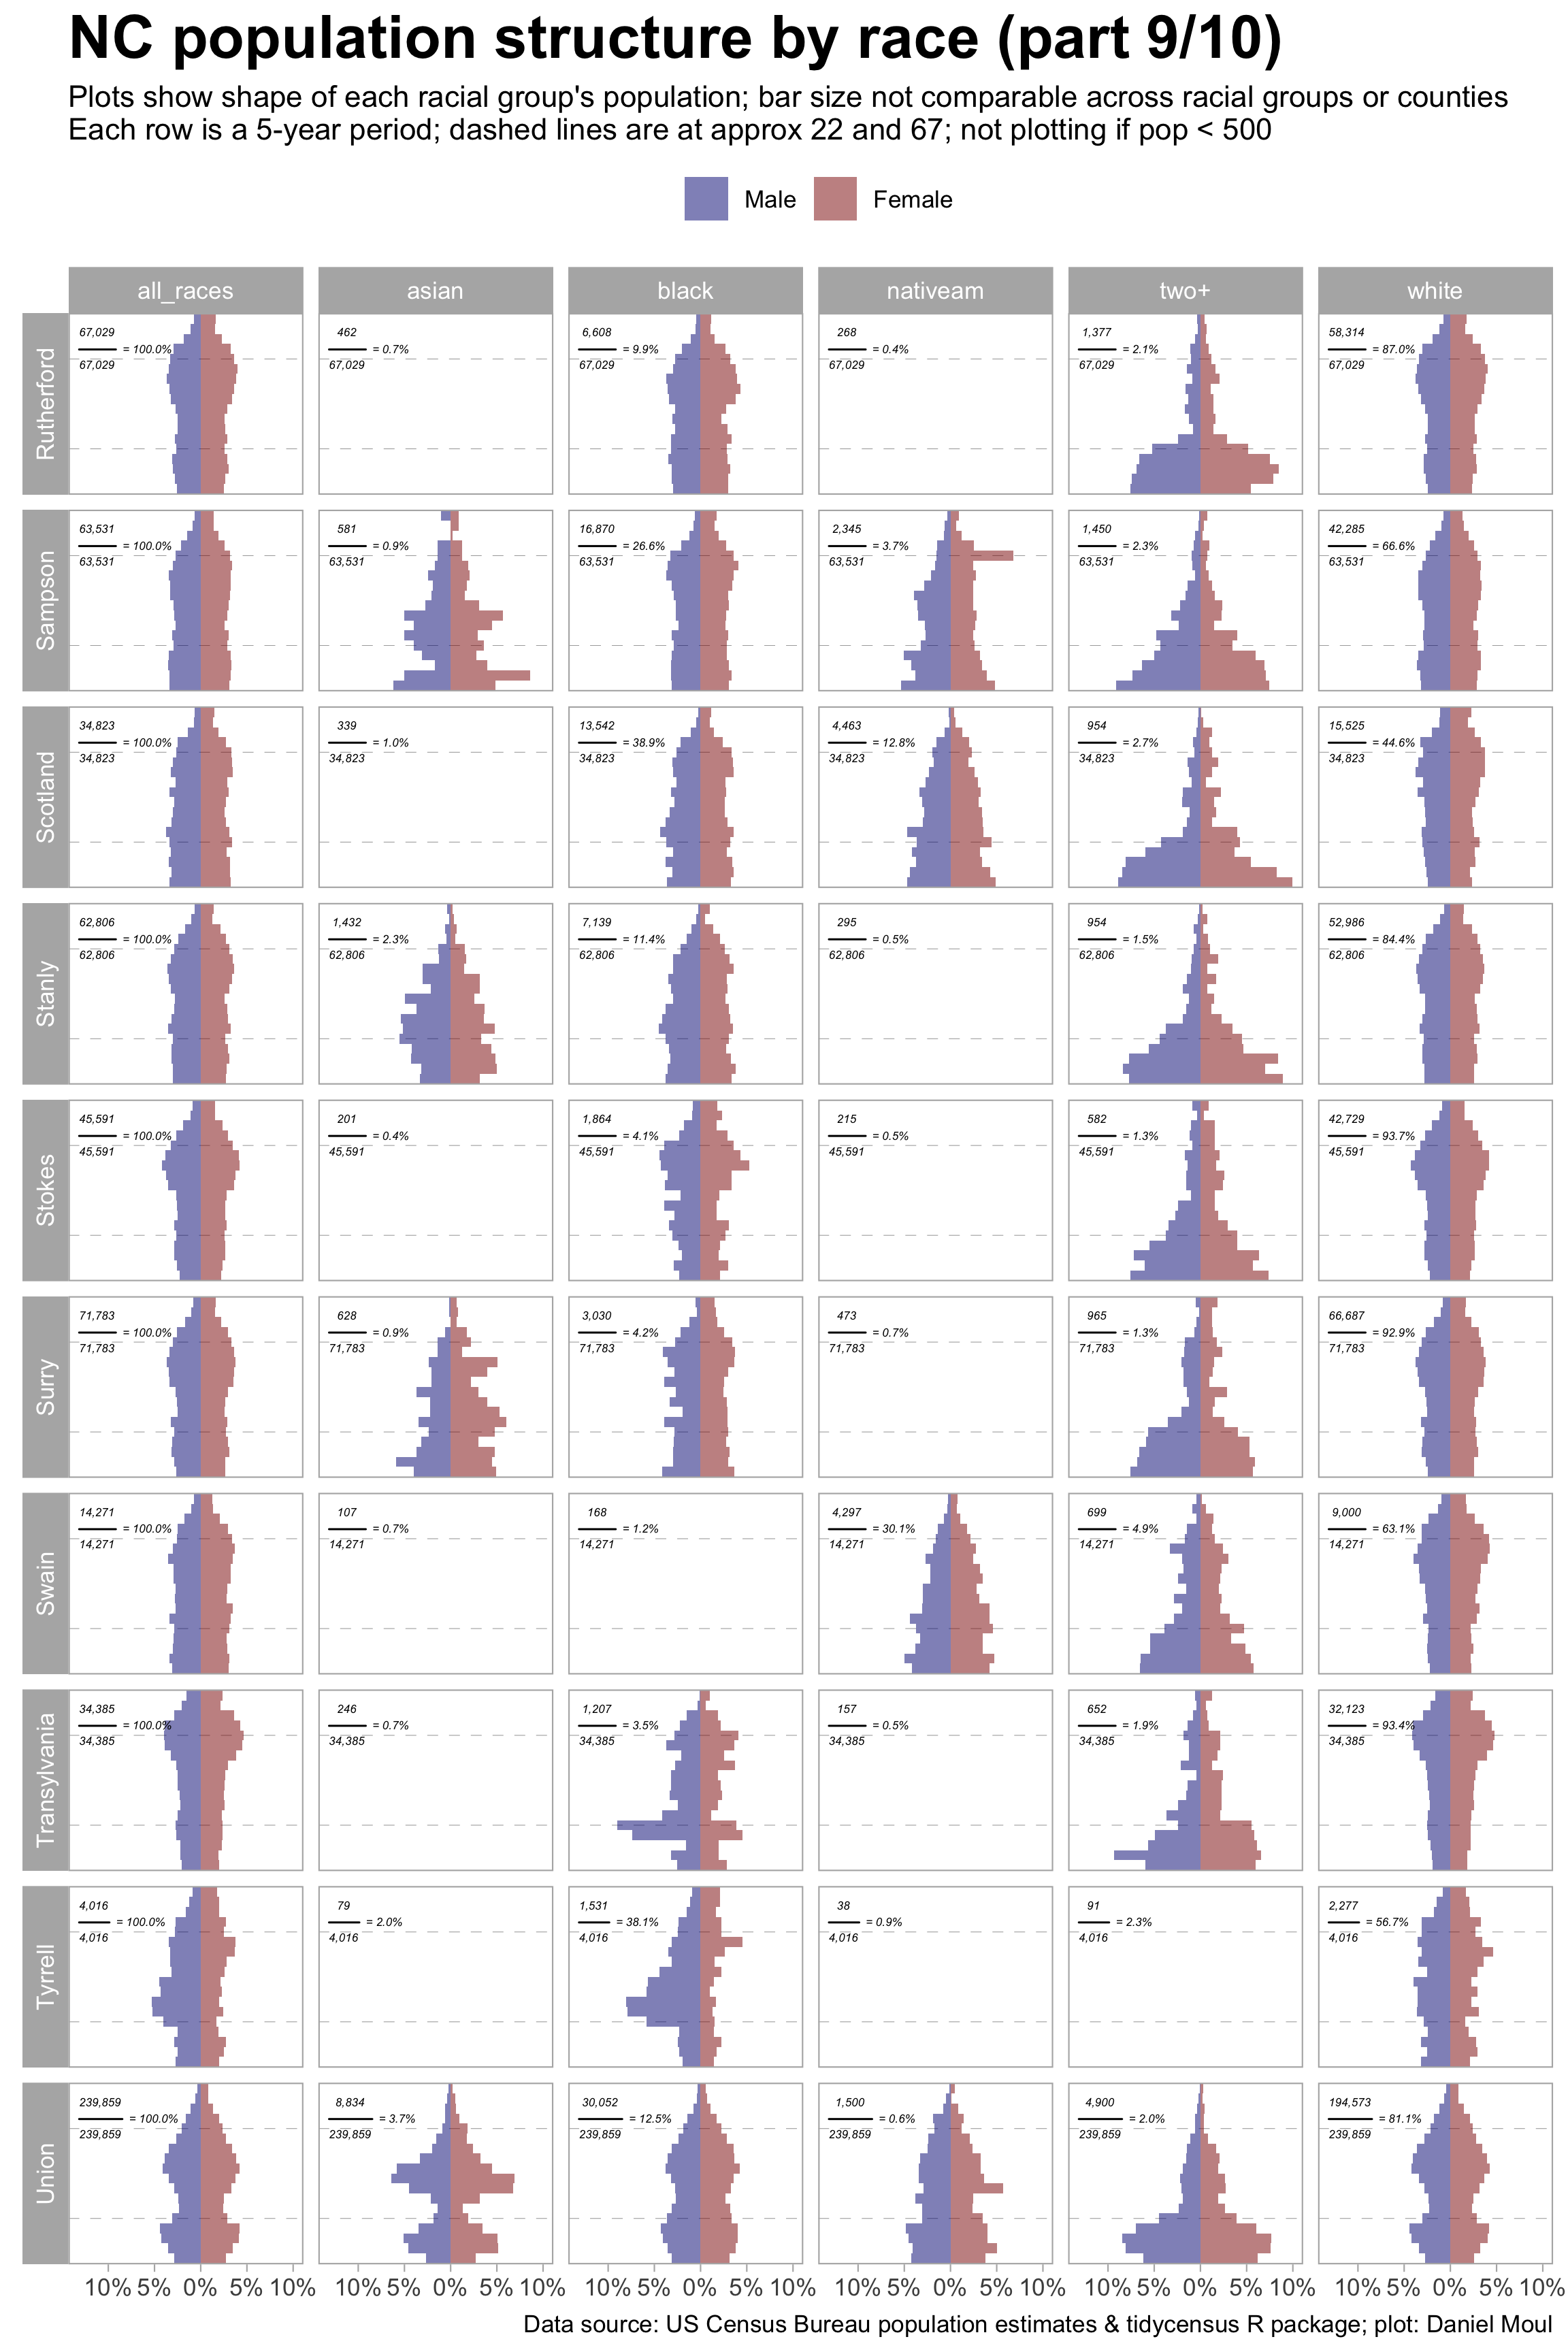
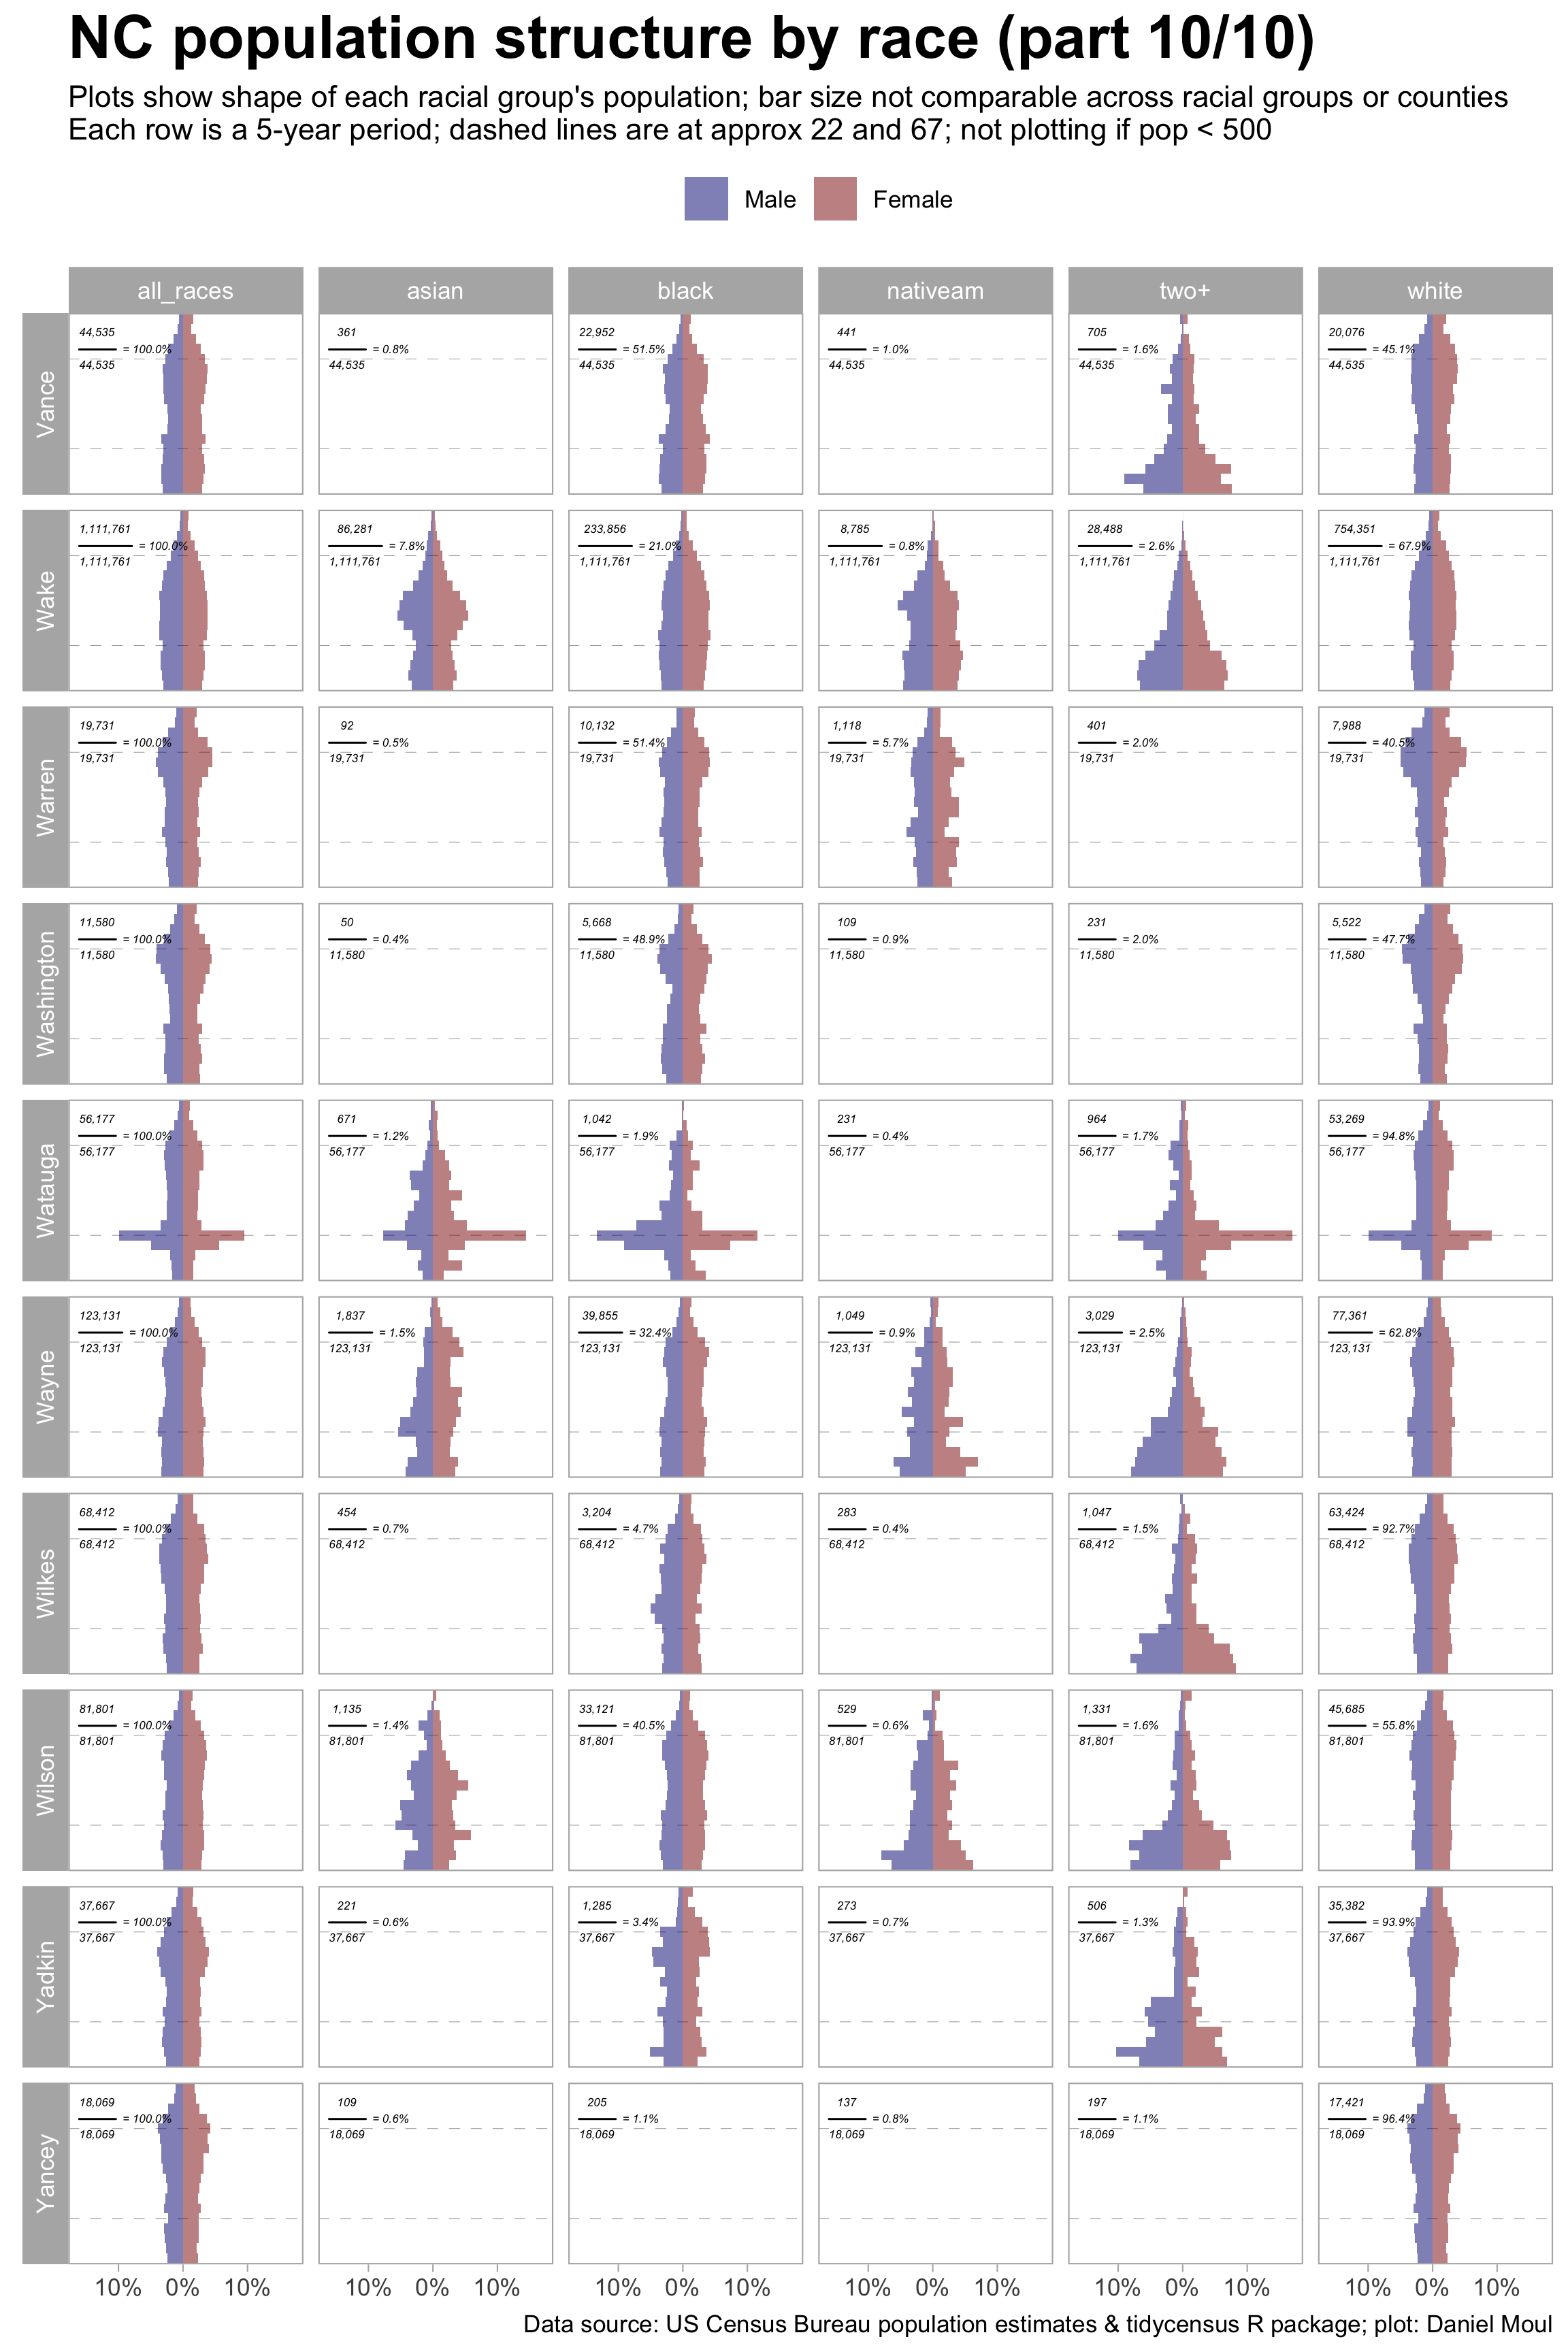
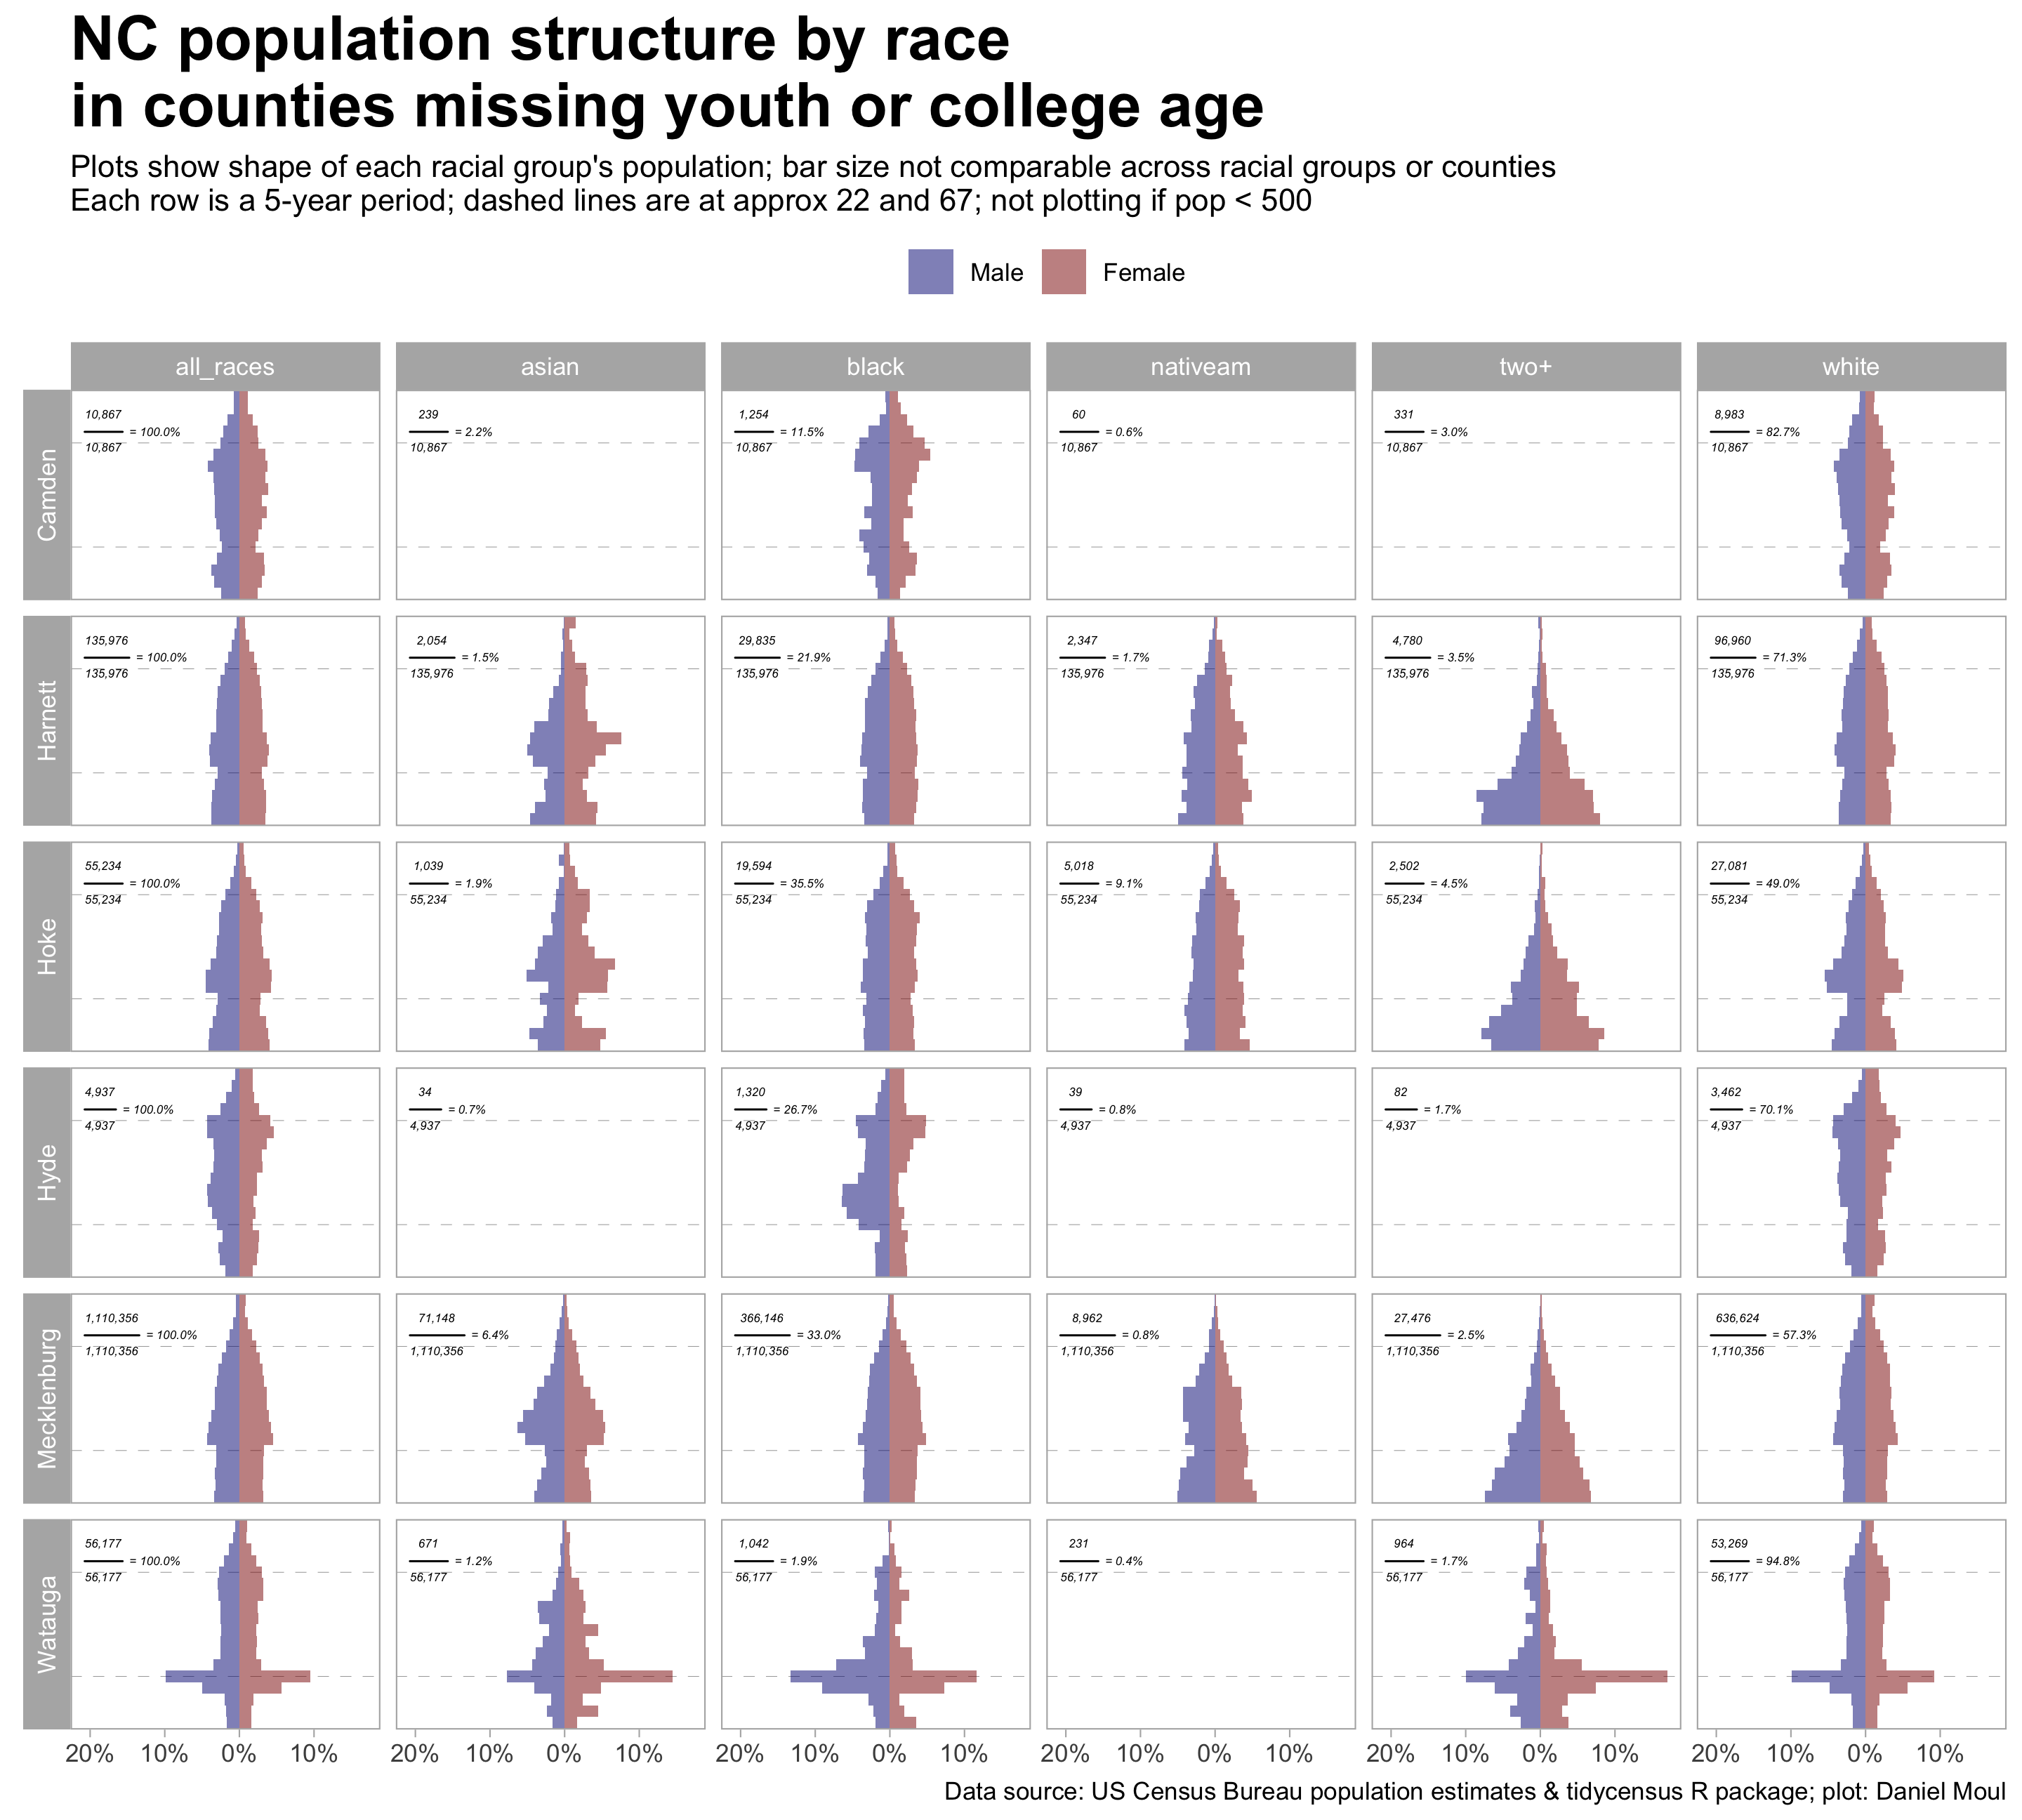
Each bar is a five-year age group with the bottom one being ages “0 to 4”. The top segment is ages “85 and above”. Male and female bars go to the left and right respectively, enabling a rough visual estimate of whether one sex has more people than the other in each age group (as is visible in Figure 4.9 and Figure 4.10). Traditionally the Census Bureau counts two genders; they started collecting more nuanced answers in 20211. Horizontal dashed lines roughly indicate the milestones of adulthood and retirement.
Each sub-plot represents the population distribution of one racial group (or “all_races”). Bars measure each age group’s proportion of that racial group’s population rather than number of people. Since blacks and whites make up such a large proportion of NC county populations, plotting counts would result in shapes so skinny that they would be uninterpretable. Thus the shape of the distributions are comparable but not the magnitude of the populations––one cannot infer relative proportion across sub-plots by comparing the width of the bars in an age category.
Large margins of error and differential privacy for small subgroups has the most impact here, so focus on the general shape, not the exact growth rate for any population segment. I don’t plot distributions for racial groups with less than 500 people in a county.
The various shapes point to likely trends, ignoring future net inflows or outflows or changes in family size. Imagine the shapes moving upwards through the years: shapes with a narrower base than middle (white and black) are likely to decline in absolute numbers as people die. Shapes with a wider base (two+, nativeam) are likely to keep growing.
4.1.1 Regions
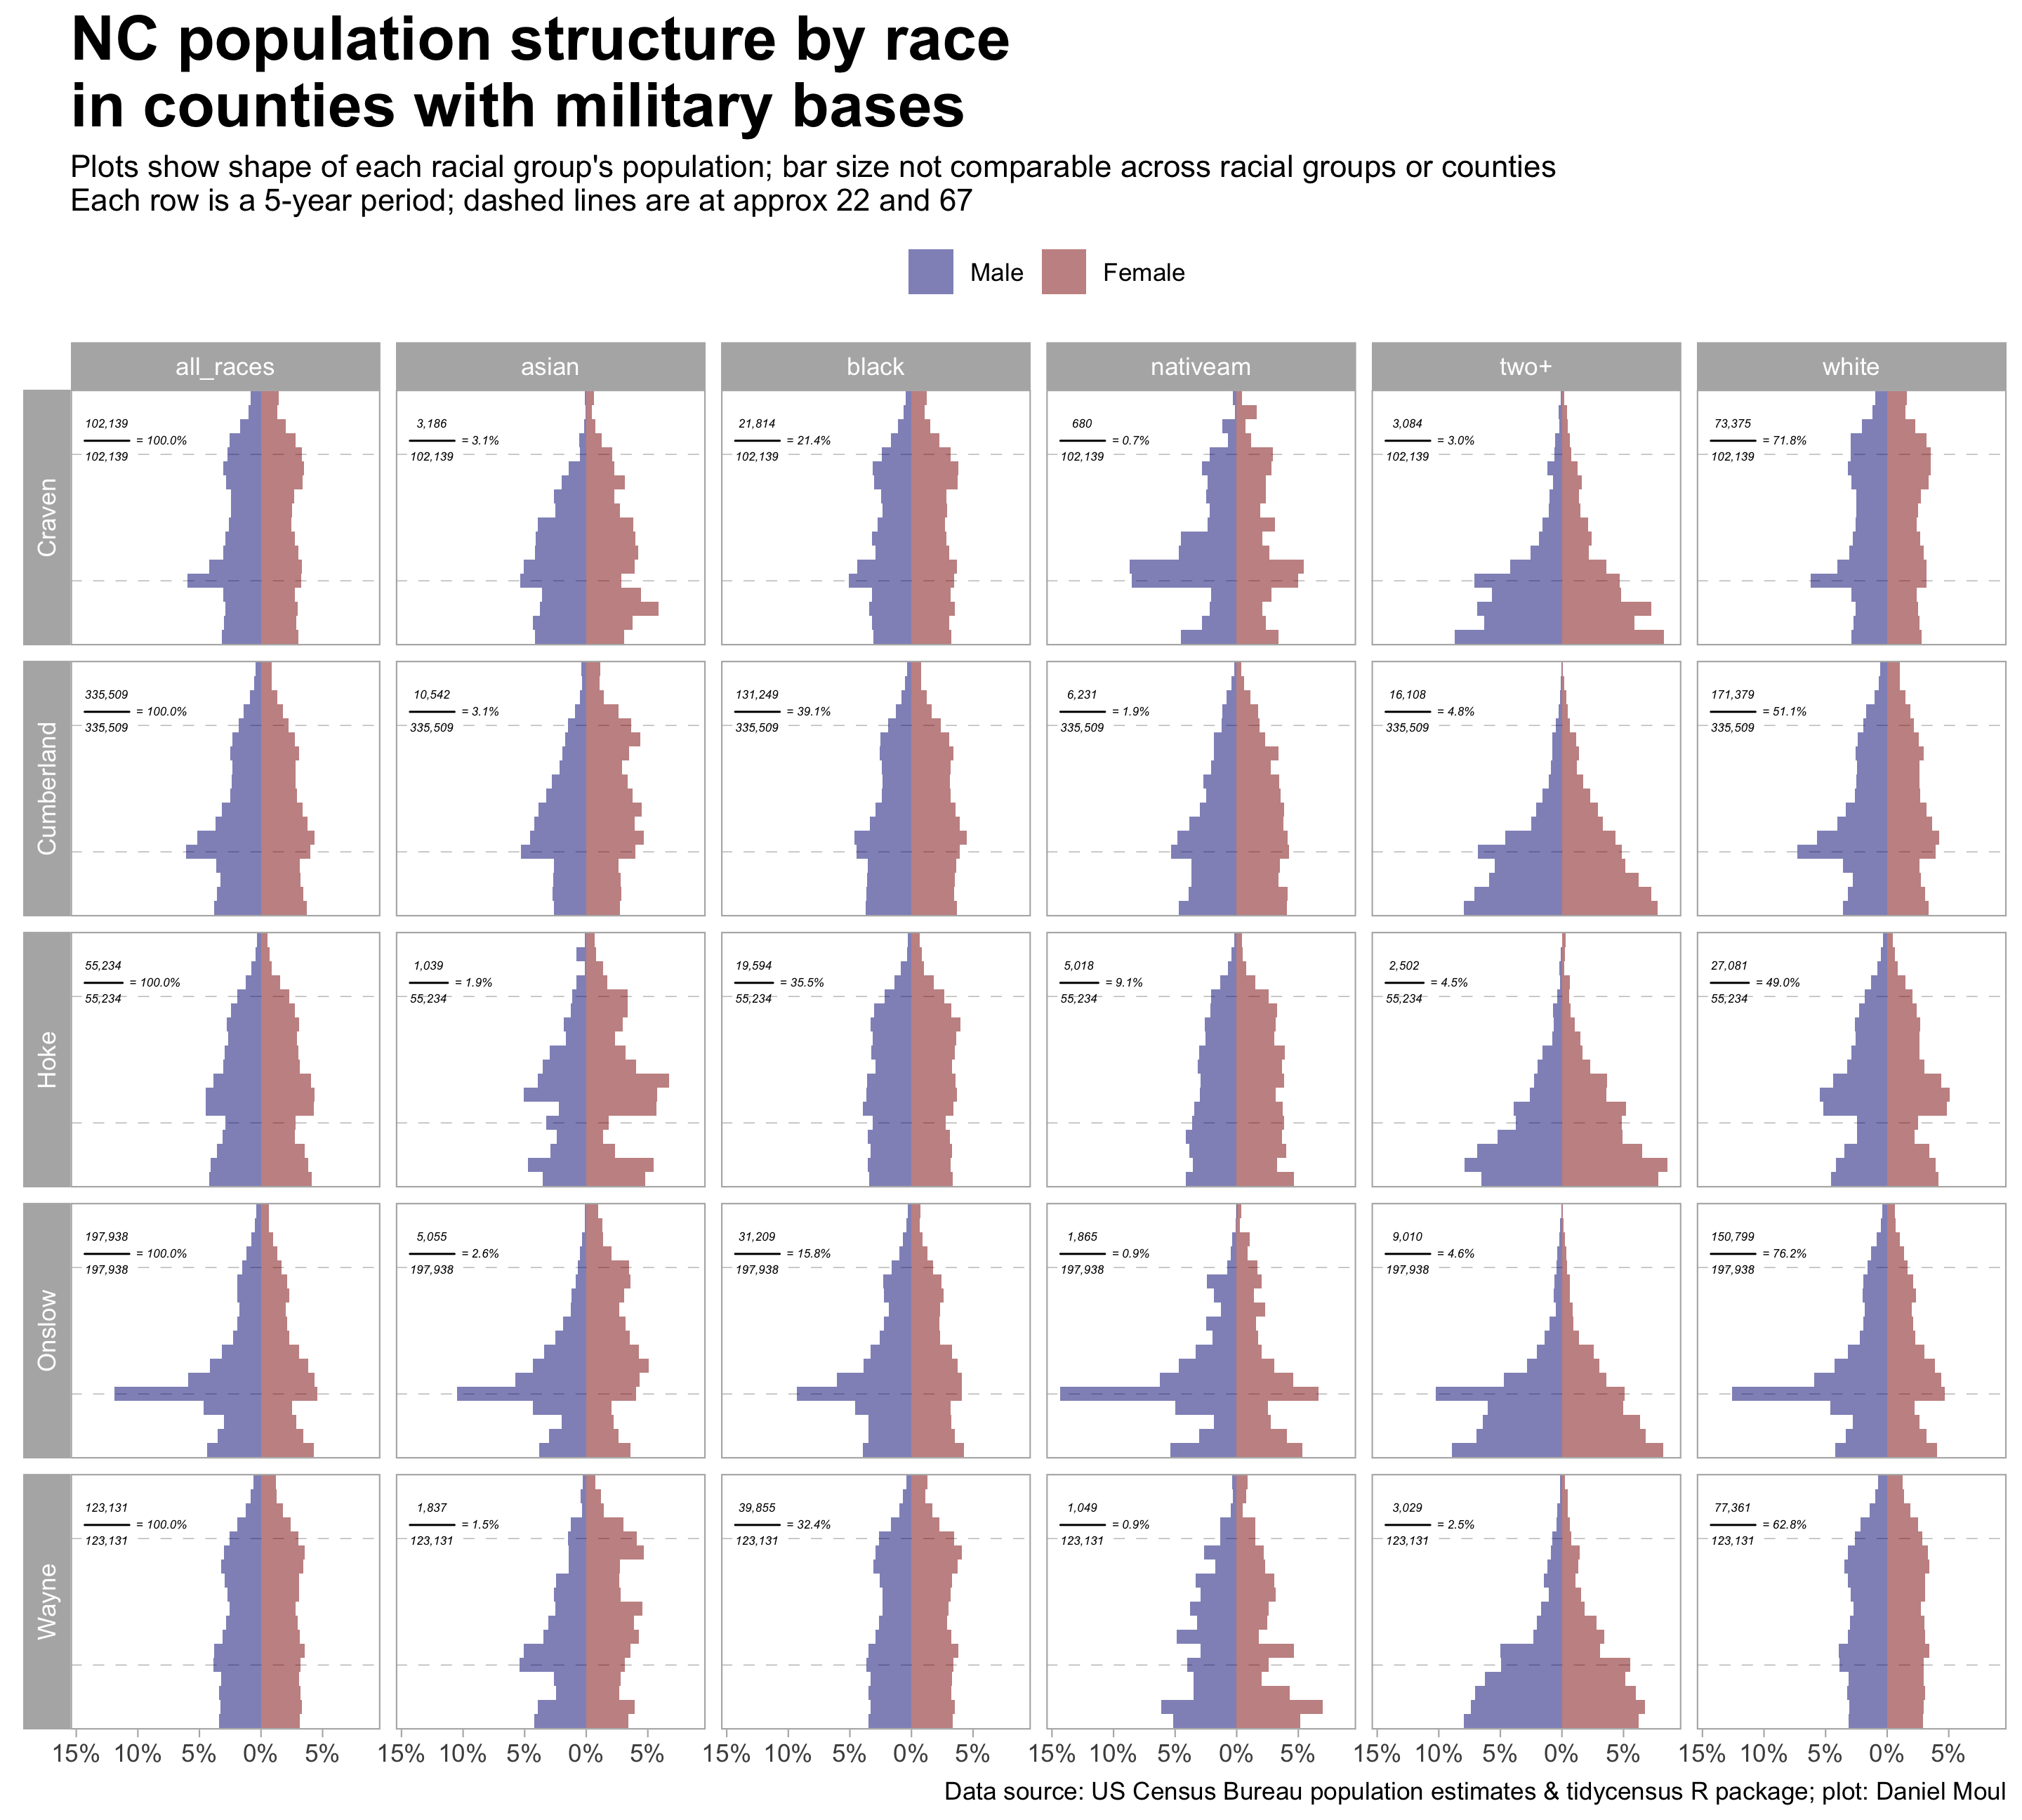
Aggregating population age groups to the regional level, distributions are generally similar with the exception of the coastal region where the influence of military bases is evident (see Figure 4.3). At this summary level, racial group differences are more pronounced.

4.1.2 Military bases
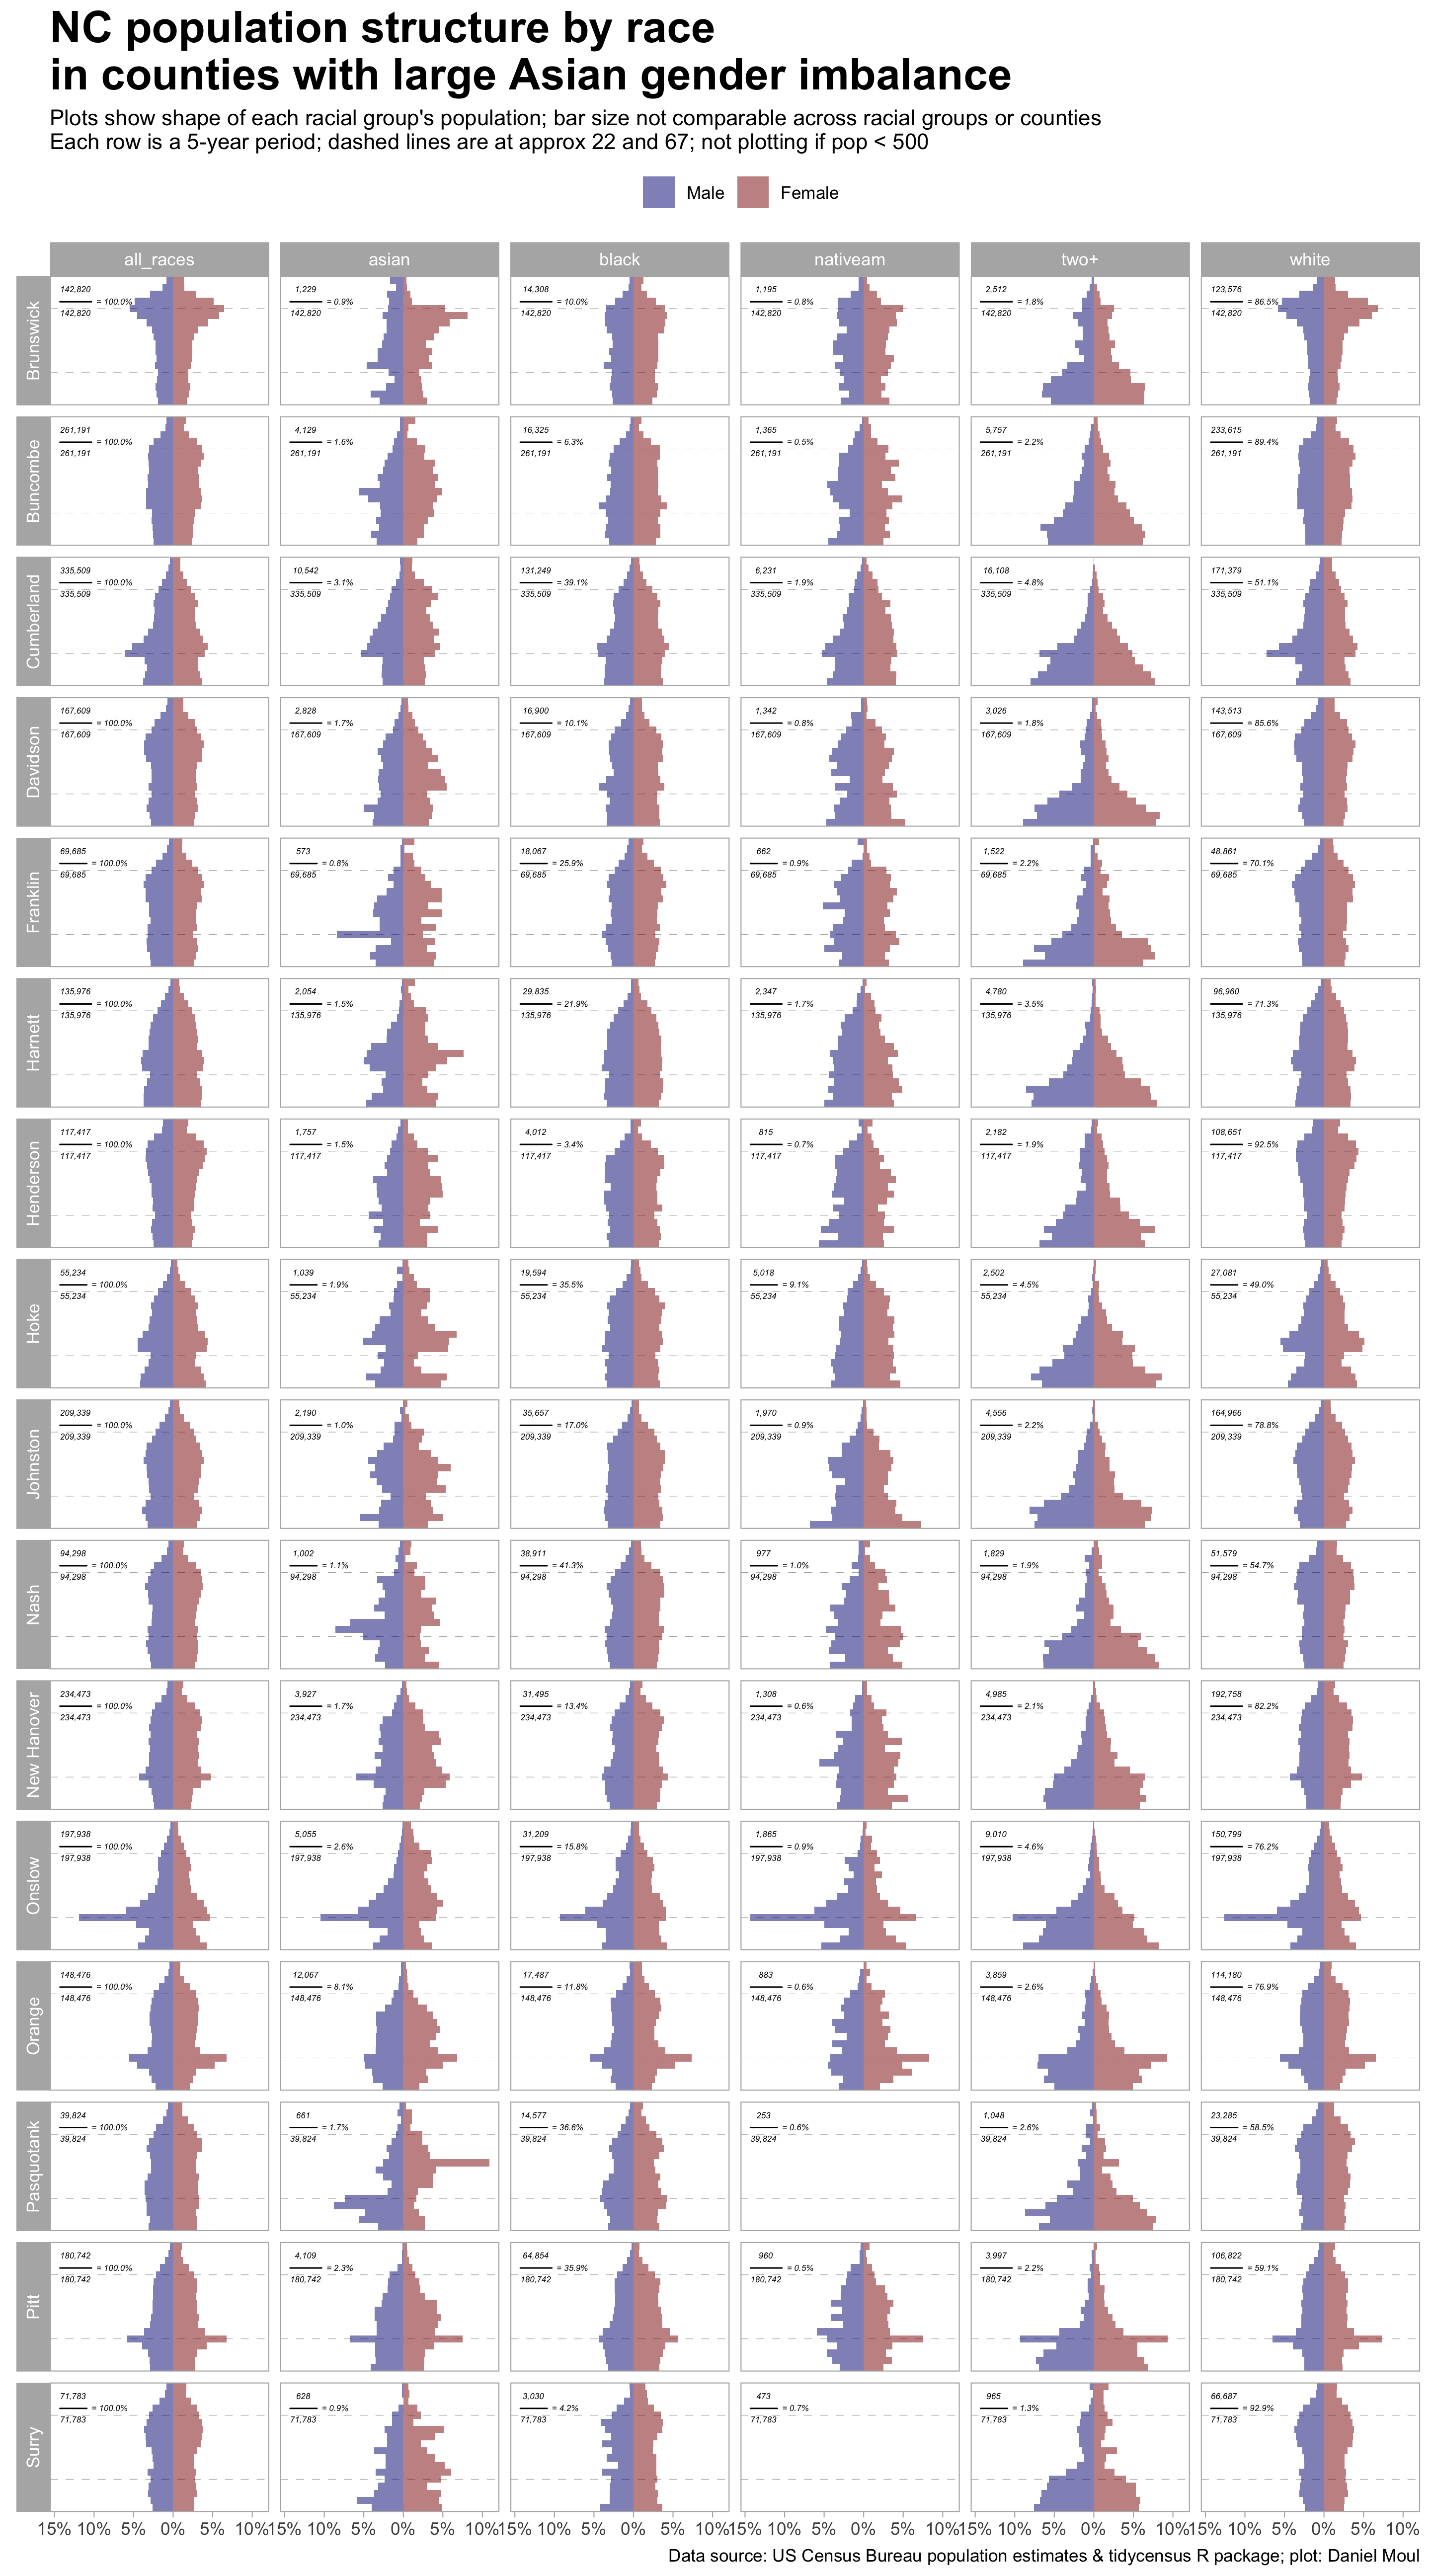
In these counties one or more military bases supply “extra” people mostly in their twenties. A characteristic bar juts out to the left indicating an unusually large portion of young men in their early twenties. Onslow, home of Camp Lejeune and Marine Air Station New River, is especially unbalanced overall while the pattern varies by racial group. For example, among Asians in Onslow there are disproportionally many males in their twenties and females in their forties and fifties, and similar patterns exist in Cumberland and Wayne counties.
Counties with the largest military bases:
- Craven (Marine Air Station Cherry Point)
- Cumberland (Fort Bragg and Pope Air Force Base)
- Hoke (Fort Bragg)
- Onslow (Camp Lejeune, Marine Air Station New River)
- Wayne (Seymour Johnson Air Base)
4.1.3 Colleges and universities
Similar to counties with military bases, these counties have a bars that jut out representing young people at college–both male and female. In universities with a lot of graduate students, the extra width starts or continues in the years beyond 25.
Counties with large college and university student populations are listed below. The population distributions show horizontal bars around age 20 if the students are a relatively large portion of the people in their lower twenties:
- Cumberland (Fayetteville State University and Methodist College)
- Durham (Duke University and Medical Center, North Carolina Central University)
- Jackson (Western Carolina University)
- Mecklenbug (UNC Charlotte, Queens University of Charlotte, Johnson & Wales University Charlotte Campus)
- New Hanover (UNC Wilmington)
- Orange (University of North Carolina main campus and UNC Hospitals)
- Pitt (East Carolina University)
- Wake (North Carolina State University and Meredith College)
- Watauga (Appalachian State University)
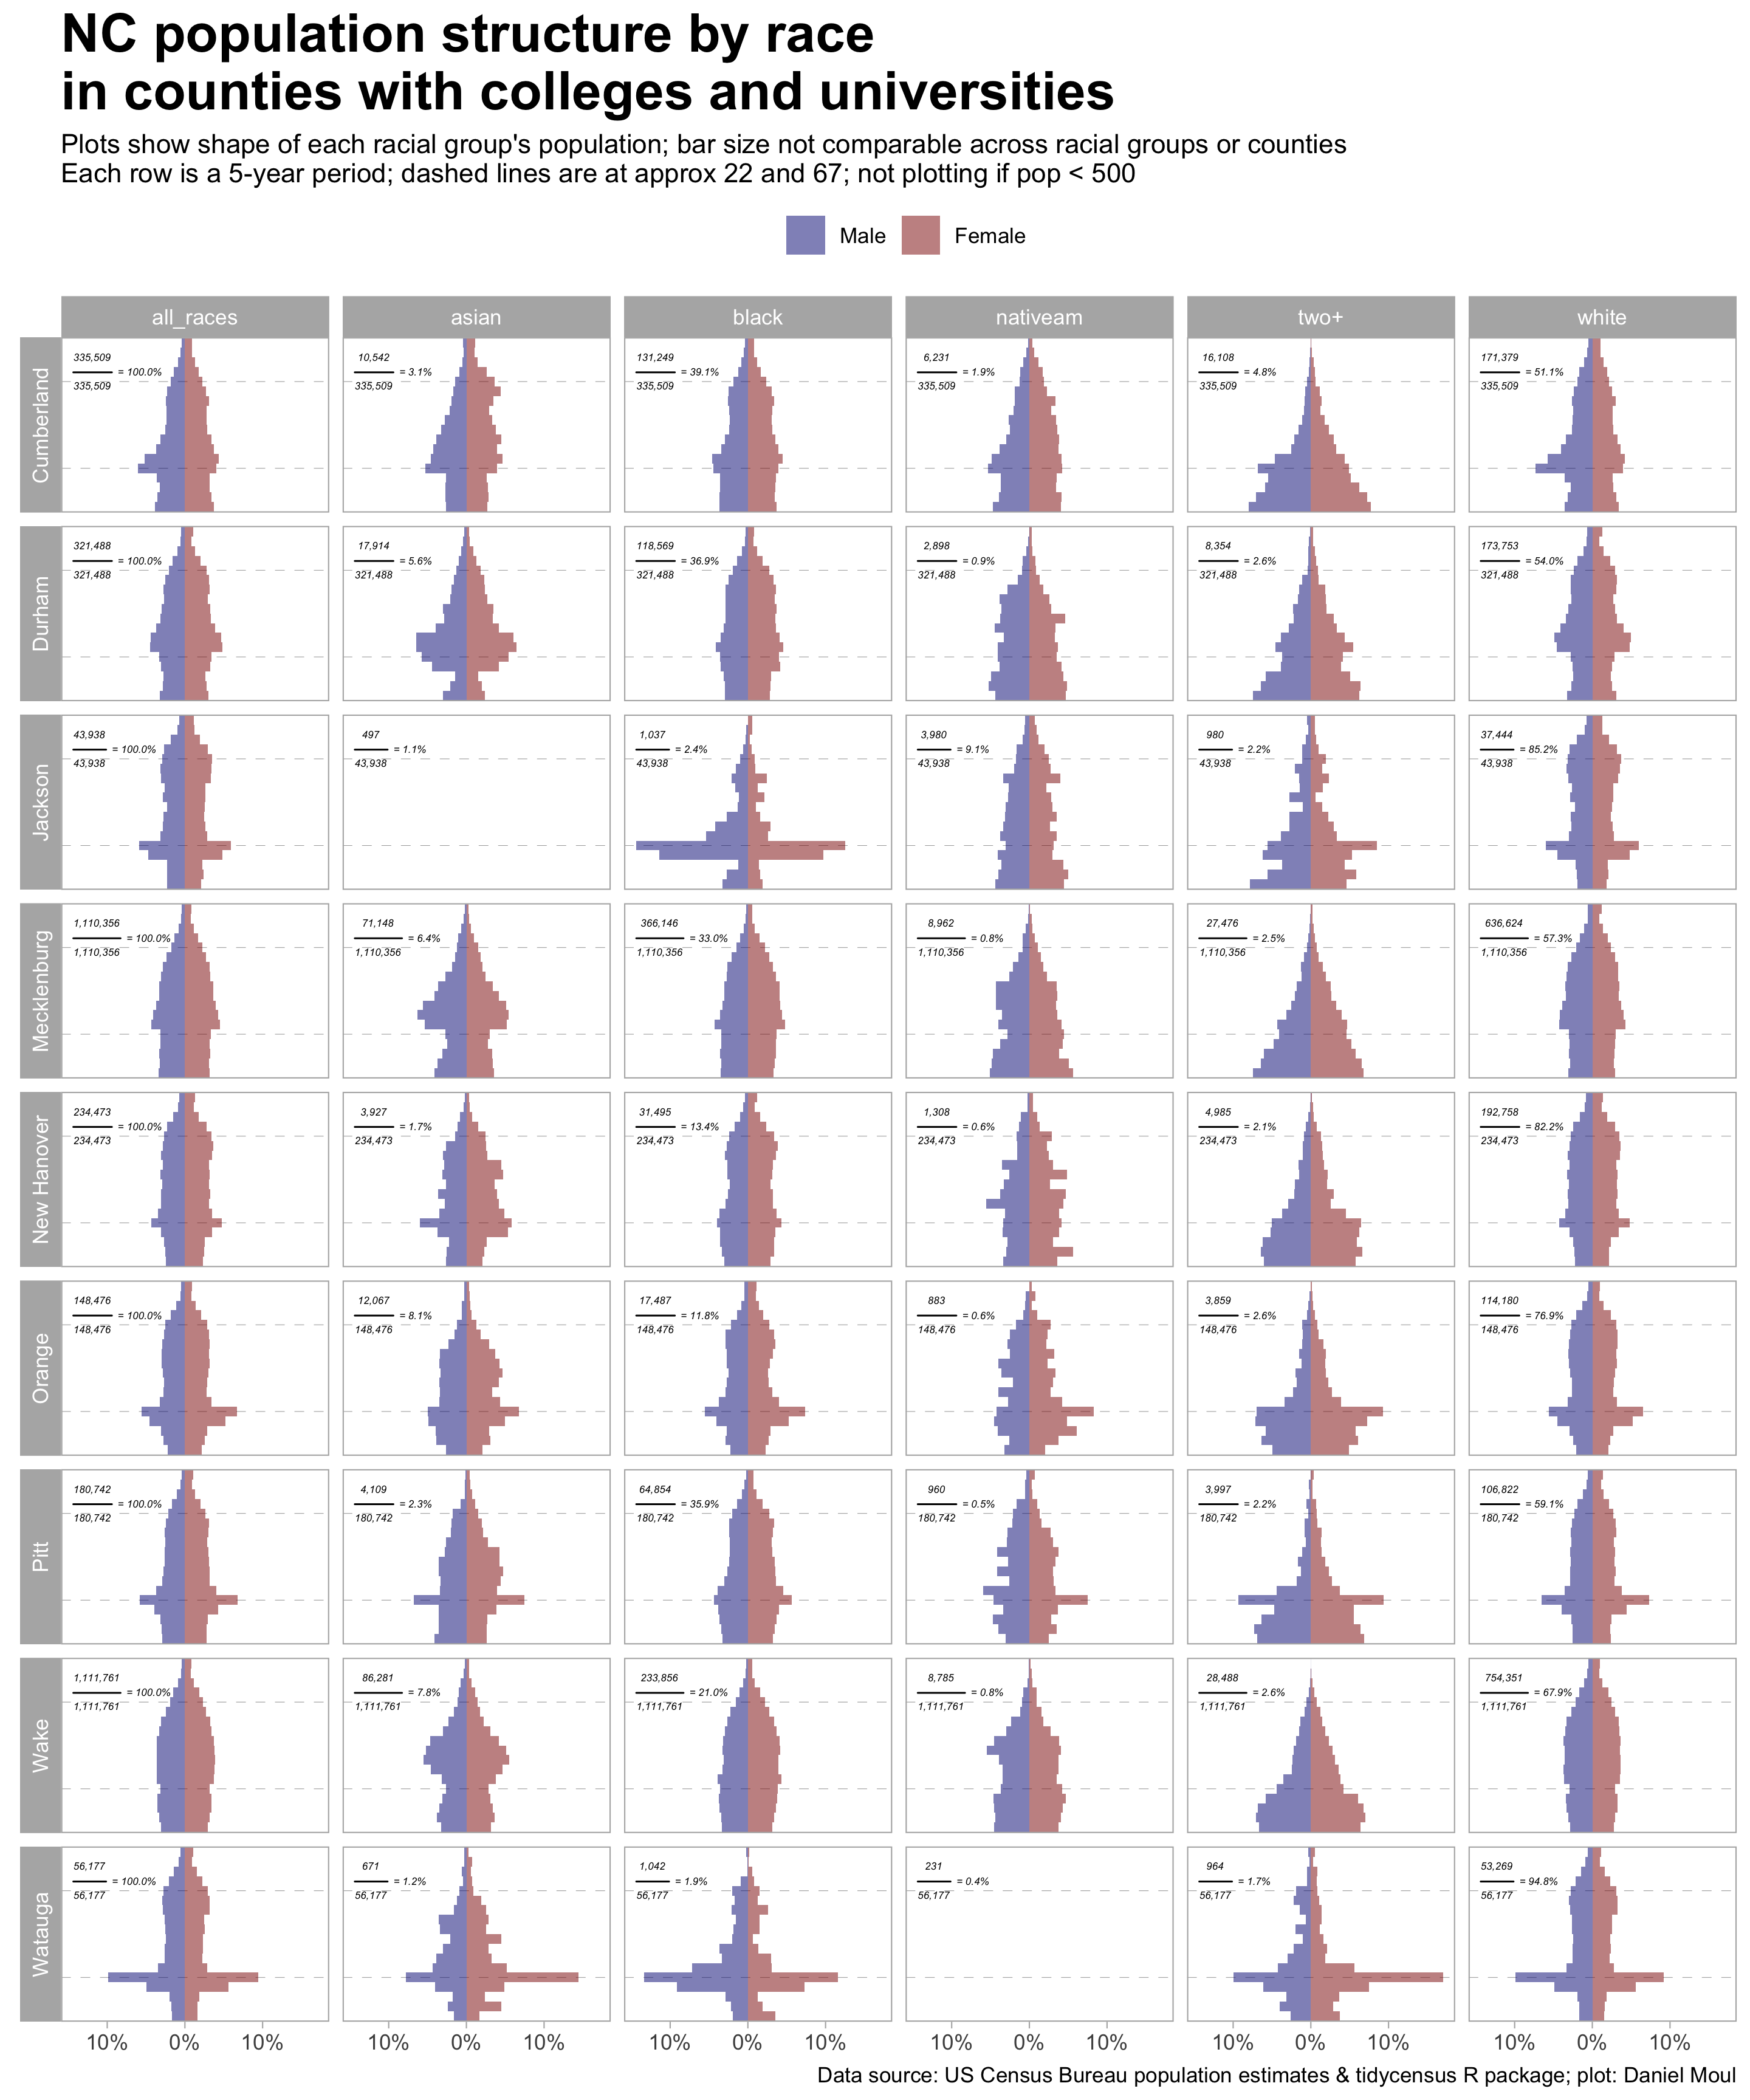
In Mecklenburg and Wake counties, the university populations are small relative to the whole counties, so their plots lack the characteristic bump in the late teens and early twenties.
In Figure 4.4 we see gender imbalance among certain racial groups in some counties, for example:
- White males in Cumberland county (likely due to military bases)
- Asian and “two+” female students in Watauga county (likely reflecting campus composition at AppState)
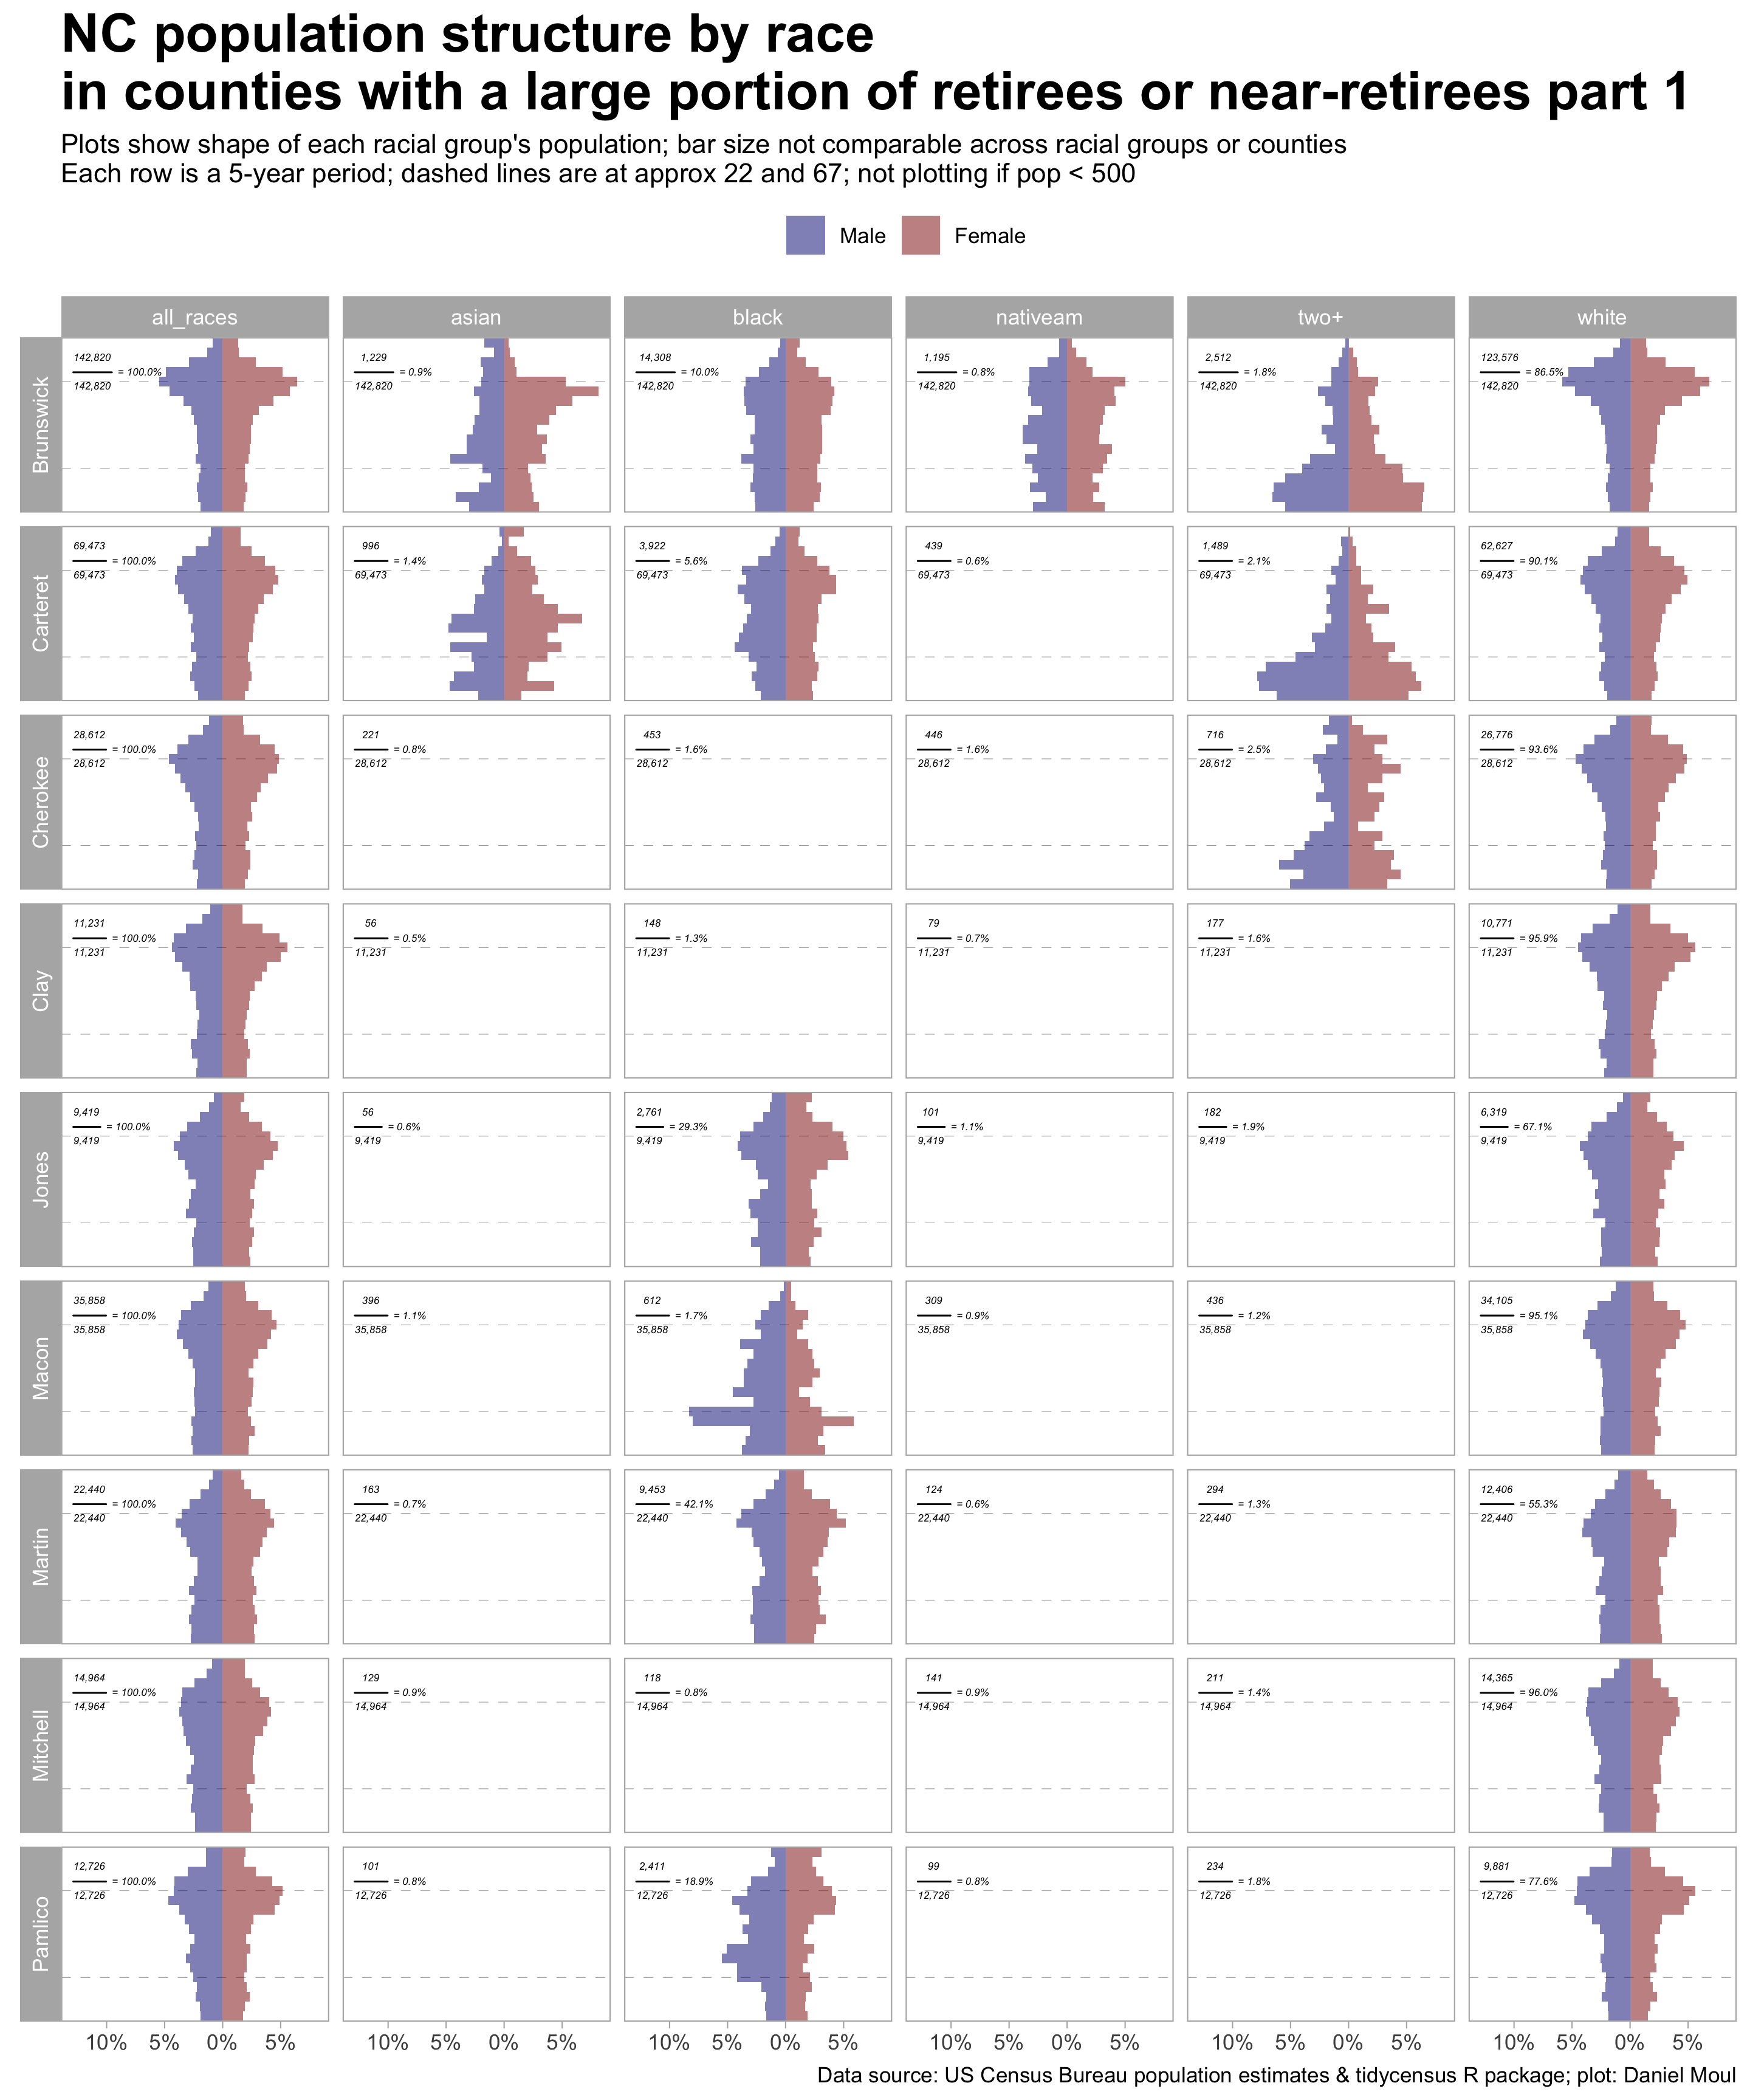
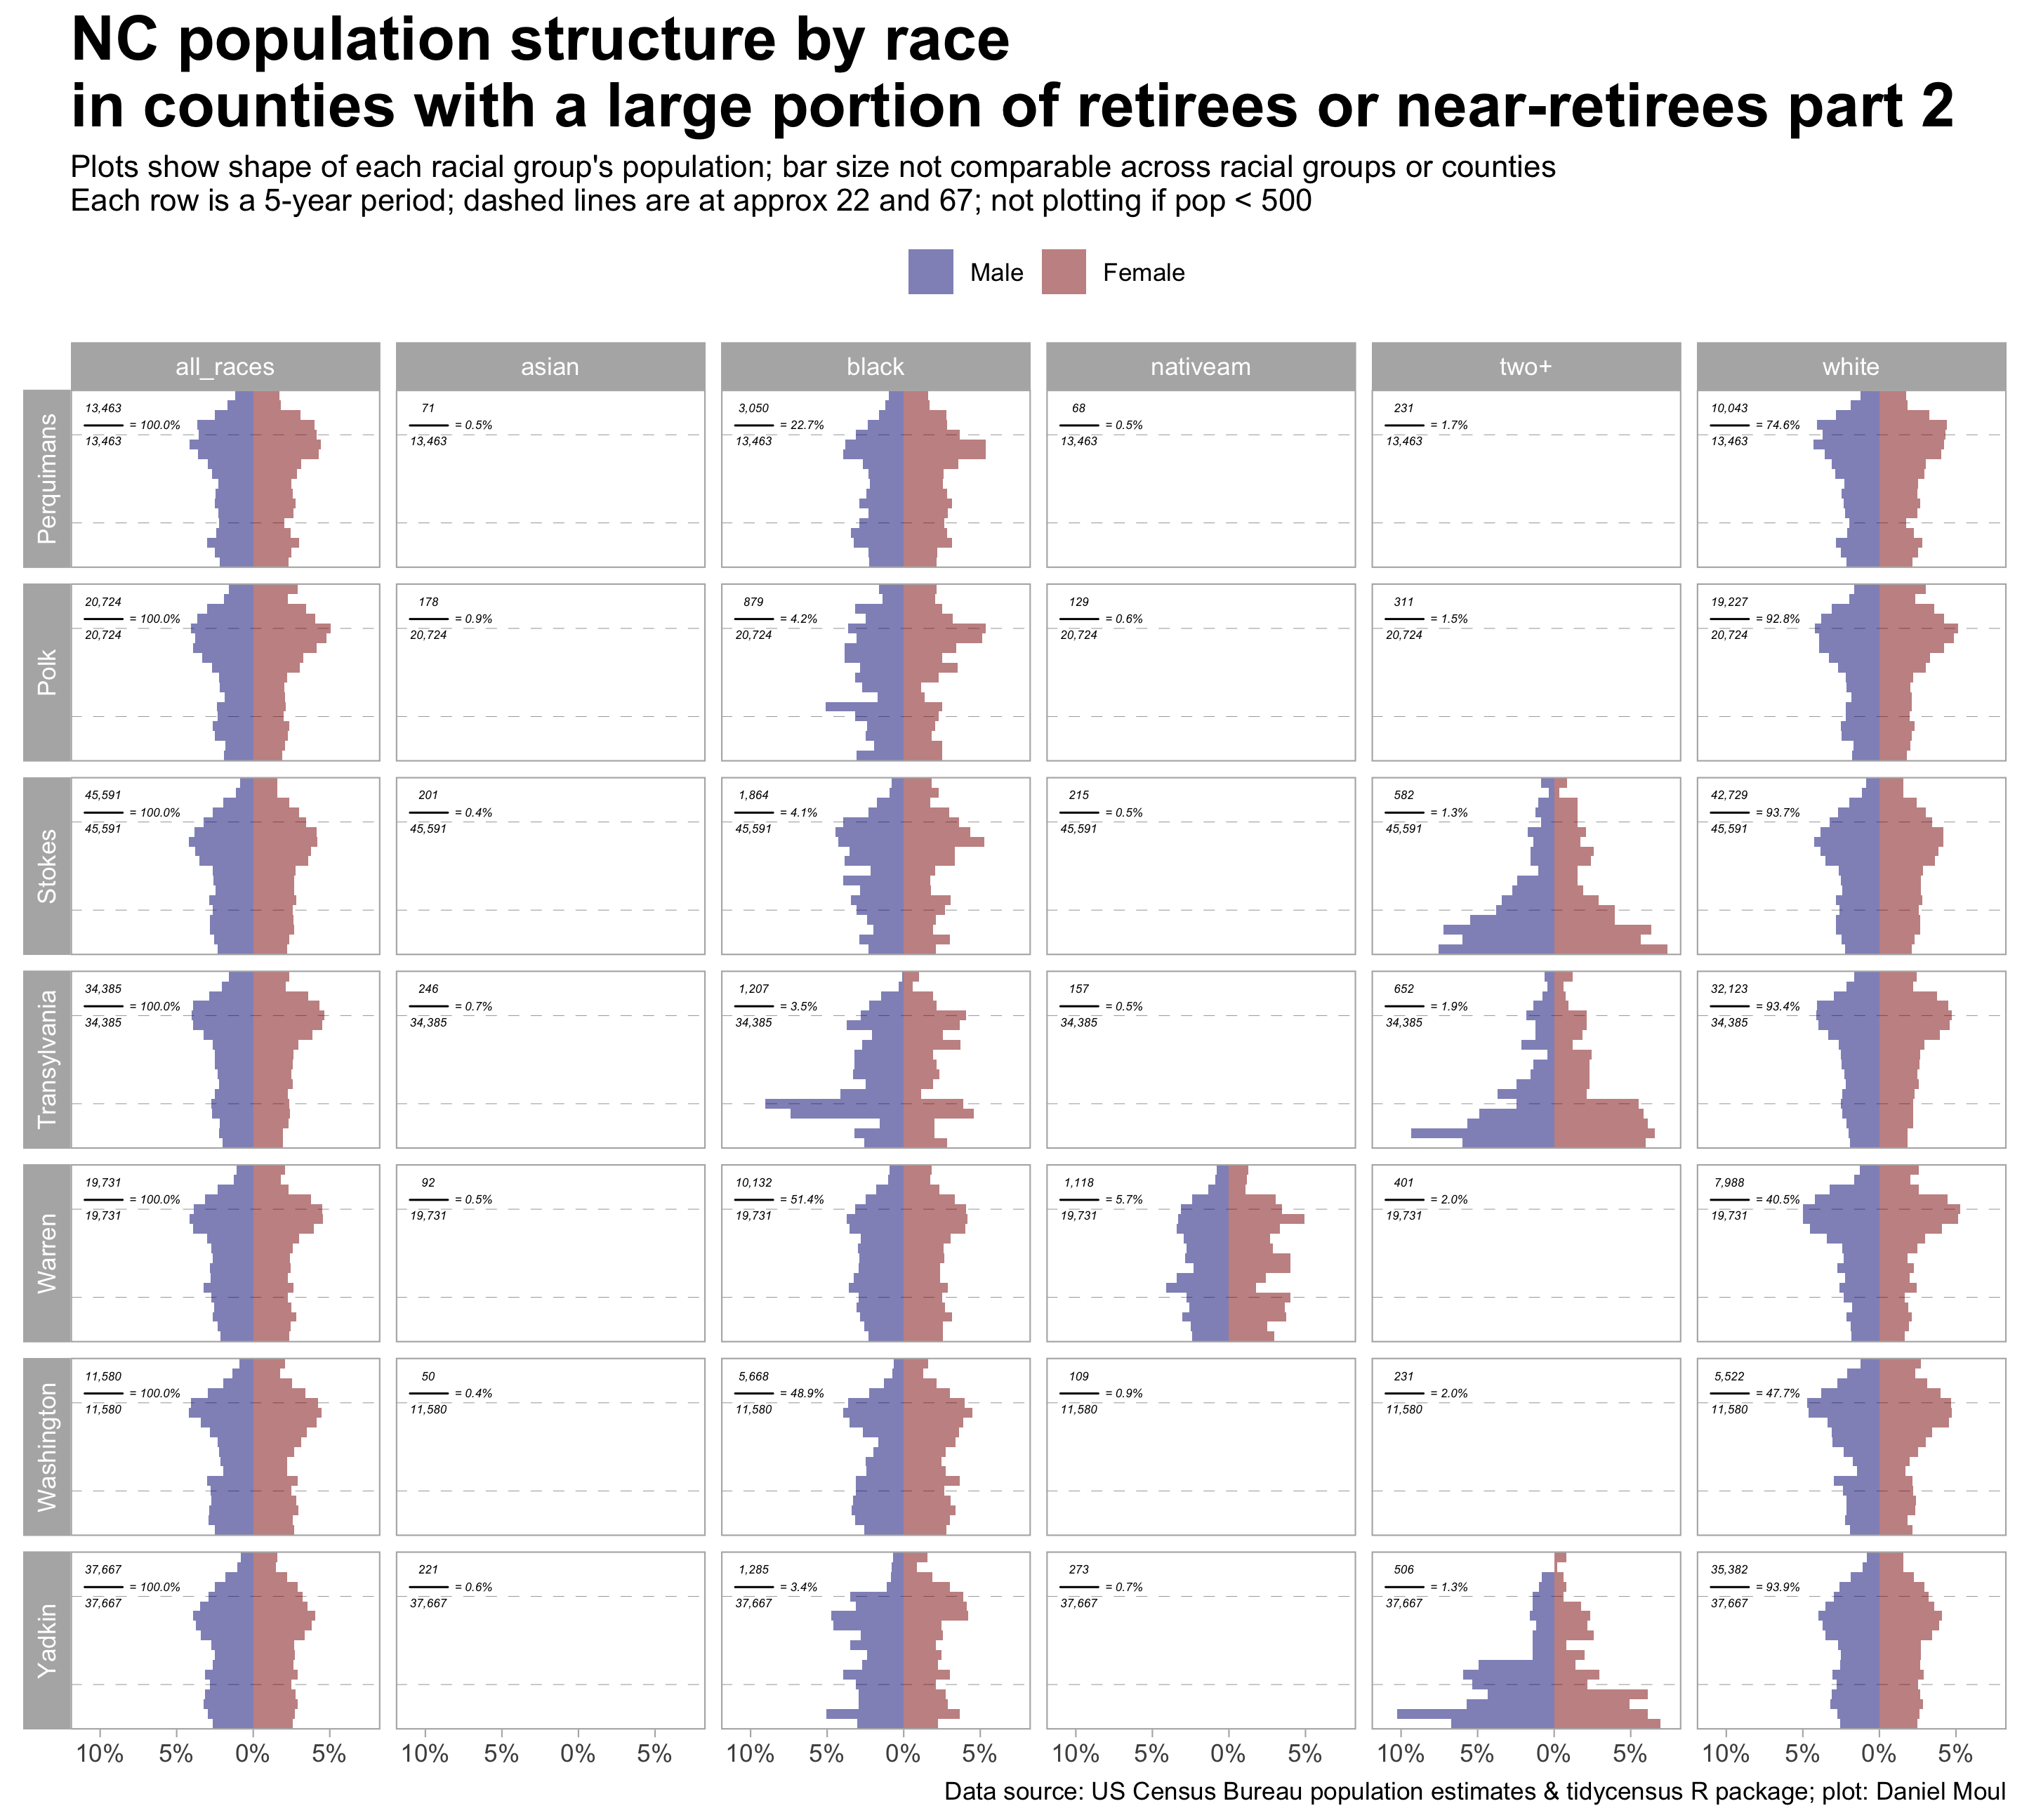
4.1.4 Retirement-heavy counties
The population distributions of these counties include a characteristic bulb in the ten years or so before and after retirement. This is most common among whites and in counties with some of the smallest, rural populations. The Asian, Native American and two or more groups typically make up a very small proportion of these counties’ population.
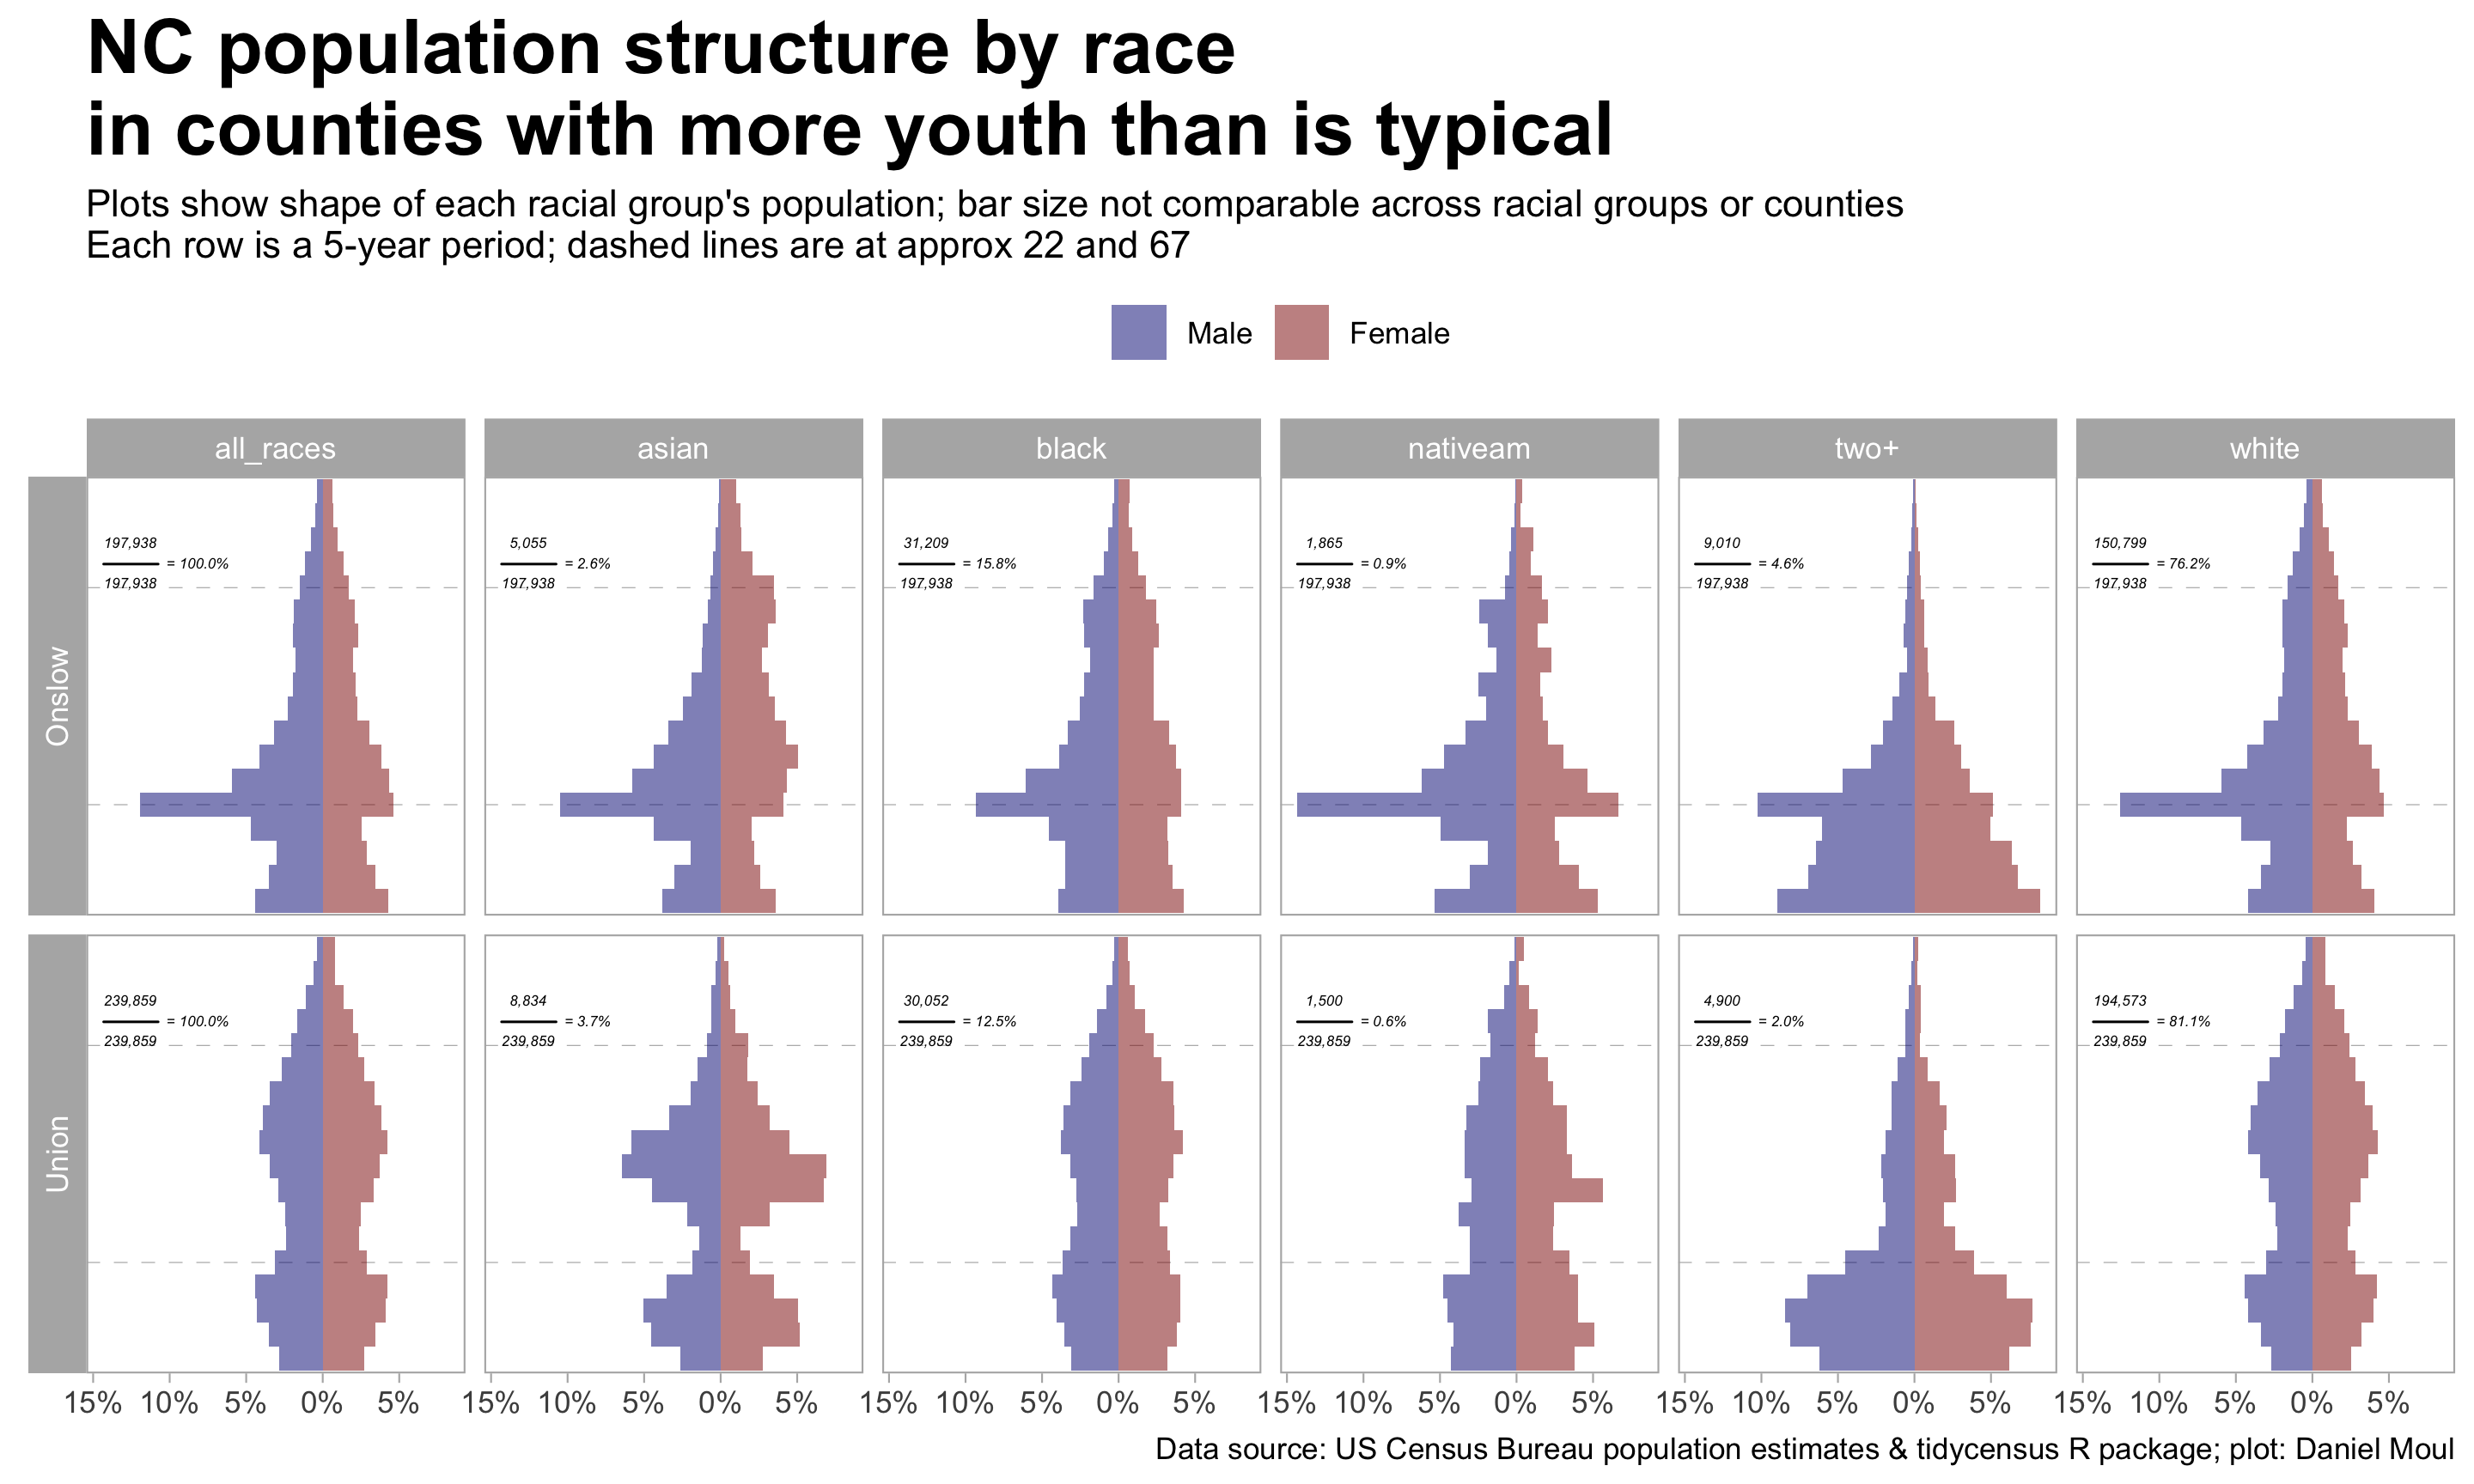
4.1.5 With more youth than is typical in NC
The “echo” of families with children are evident when there is a narrow waist followed by a wide foot.
4.1.6 Missing youth or college age
A narrow “waist” at age 20 or a very narrow foot indicates a relative dearth of young people.
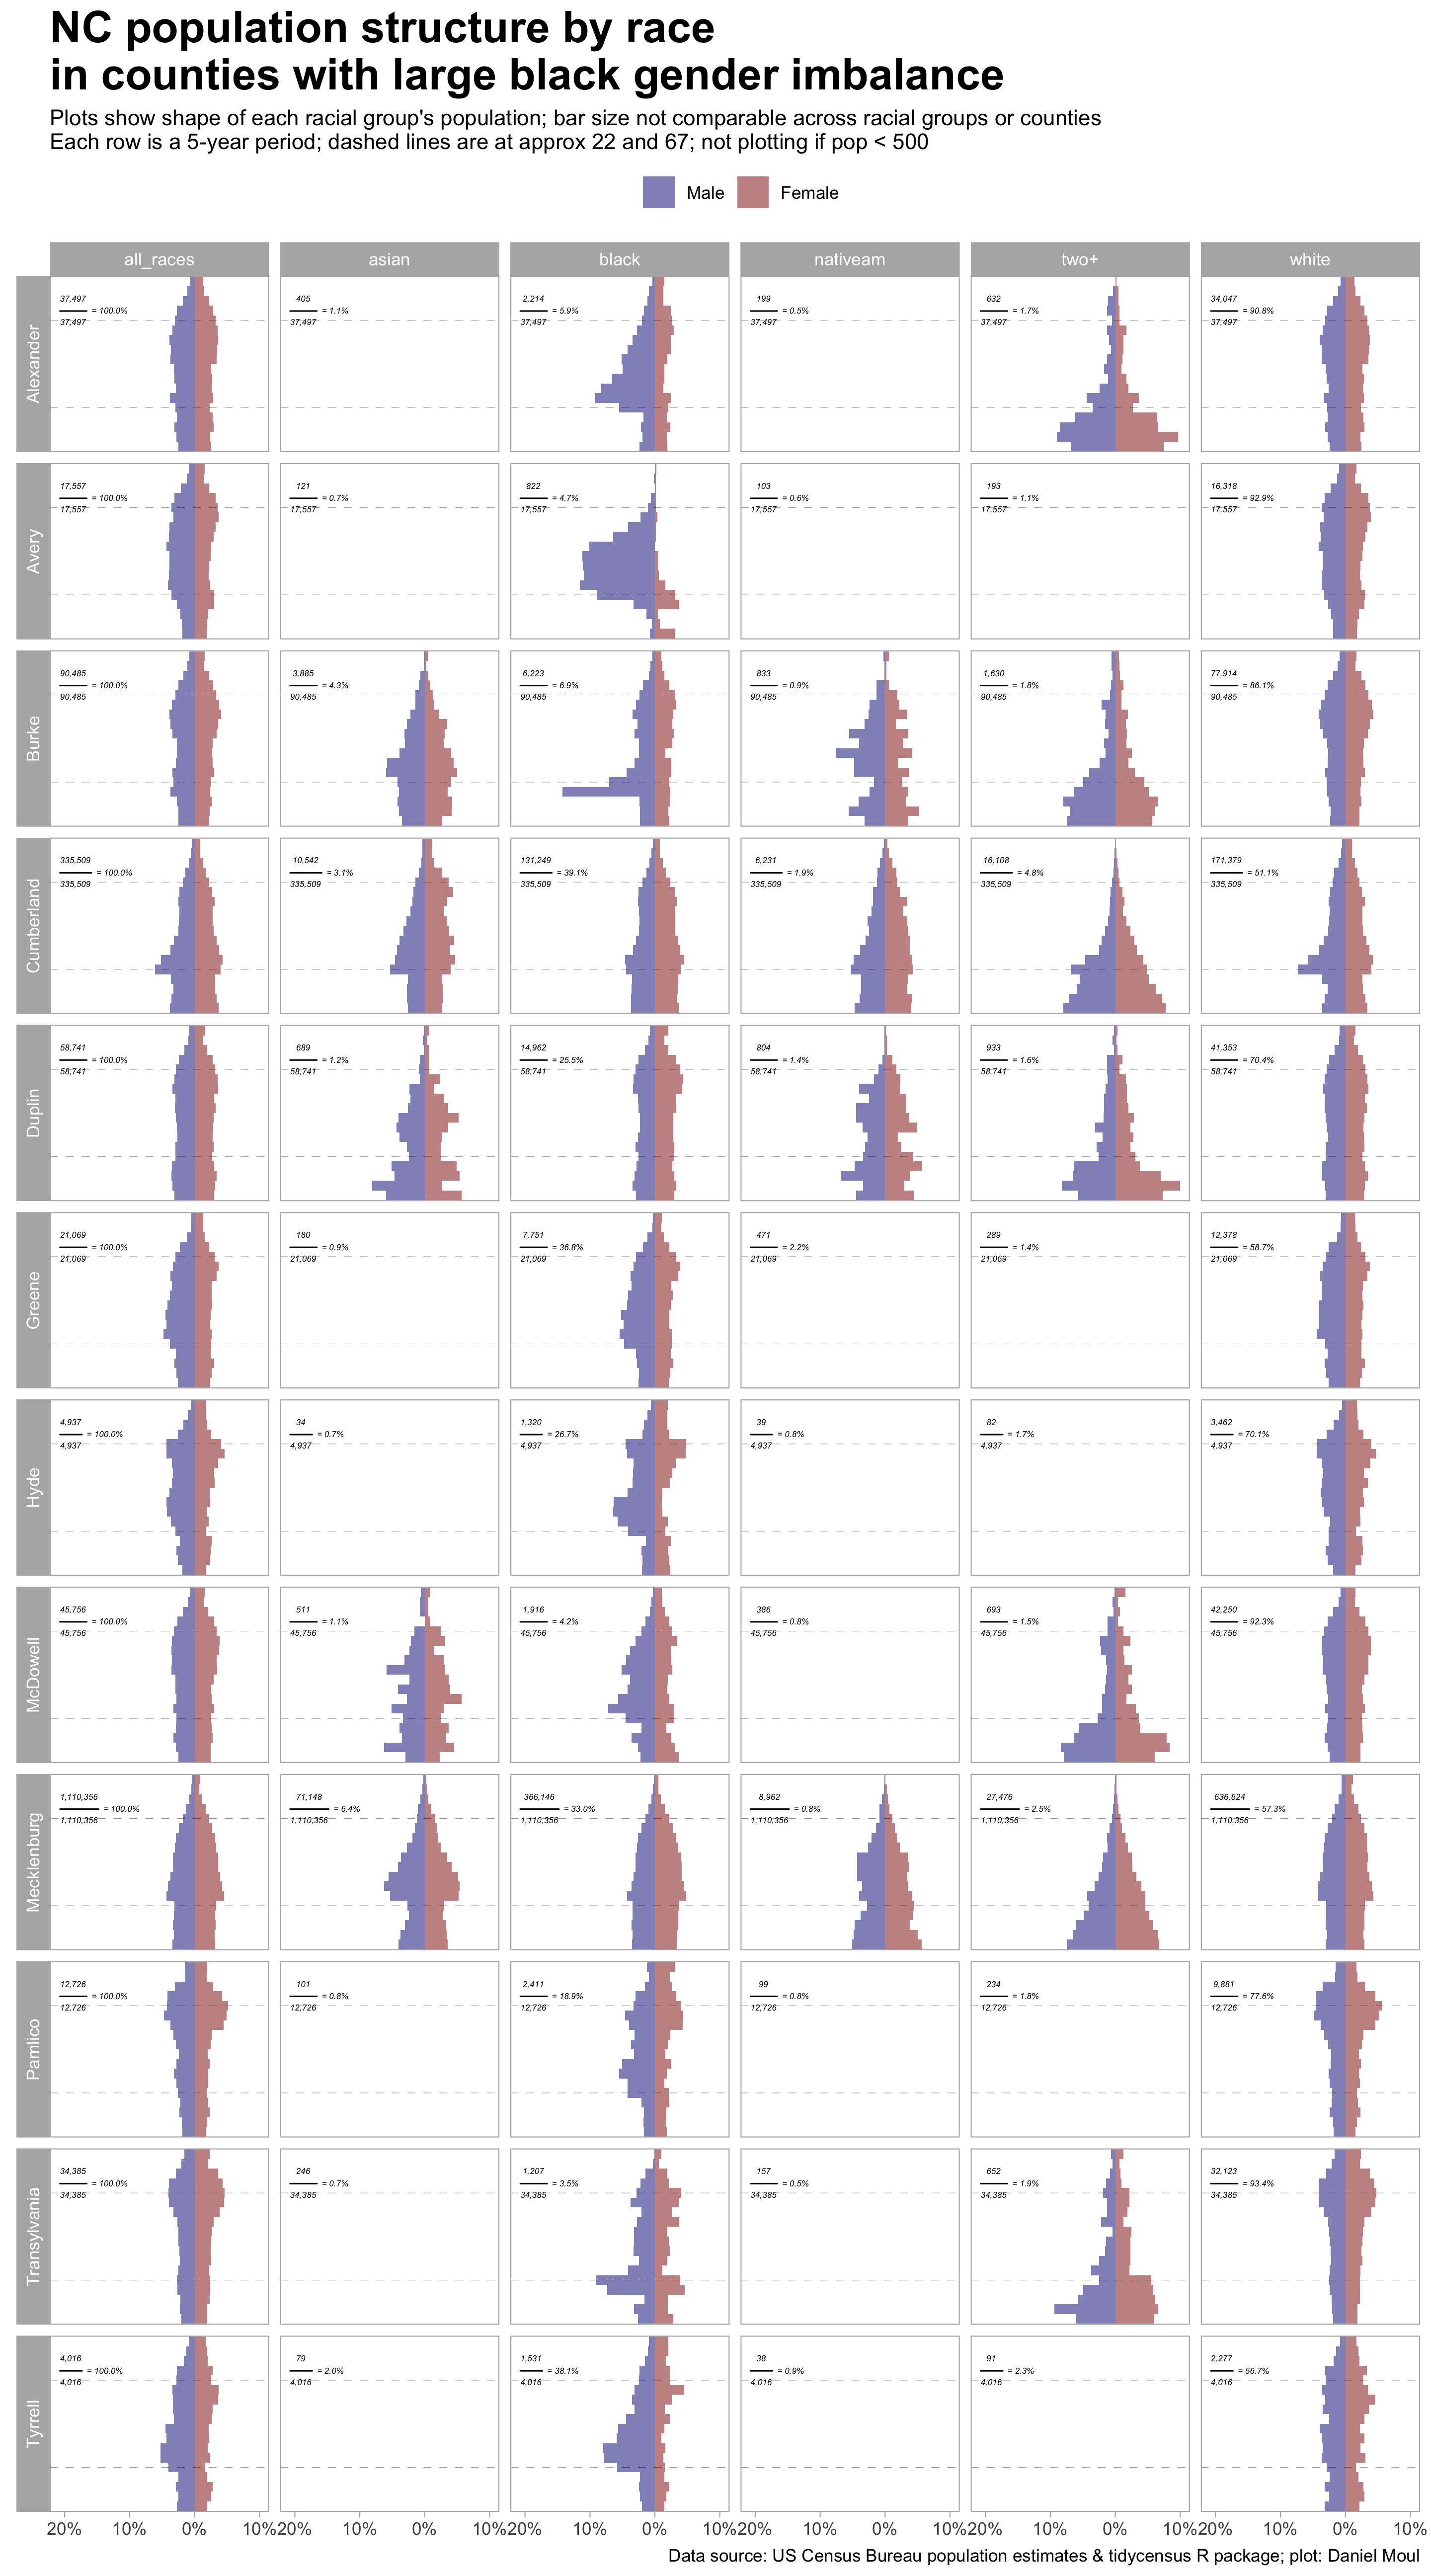
4.1.7 Counties with large gender imbalance
Gender imbalances have many causes, including (1) immigration patterns (do men and women immigrate in similar numbers in similar age groups?); (2) institutional draws (schools, military, correctional facilities); (3) employment draws; and (4) old-age survivorship rates. In North Carolina the most visible gender imbalances can be found in Asian and black groups in a subset of counties.
4.2 For reference: all NC counties
The following ten plots show the population distribution by racial group for all 100 NC counties in alphabetical order.
TODO: move this to the appendix(?)