Mudd, Gavin (2023): A Comprehensive Dataset for Australian Mine Production 1799 to 2021. RMIT University figshare. Dataset. https://doi.org/10.25439/rmt.22724081.v2
I downloaded “Aust-Mine-Prod-v01.4b-Master.xlsx” on 2023-07-20.
From the Notes sheet
The author provided the following on the “Notes” sheet
Key Assumptions & Points to Note:
All sources used adopted their own quality control and can be considered reliable for the purposes of this compilation.
Data represents the contained metal or minerals within a saleable product leaving a mine gate (e.g., contained metal or minerals in concentrates, doré bars, direct shipping ore, refined metal, saleable ore). (Note: contained metal is not the same as payable metal, which is what a mine gets paid for after deductions by a smelter / refinery).
Where necessary, mineral products have been converted to show contained metal (or element / elements) (e.g., tungsten in wolfram or scheelite, individual platinum group elements).
All prices are indicative export prices only, based on reported metal or mineral content, presented as unit price ($/t).
Monetary values have been converted to Australian dollars ($), with £ multiplied by 2 to give $.
Every effort has been made to avoid double counting, but there may still be some data overlap.
All units are metric (e.g., 1 tonne is 1 million grams; g/t are grams per tonne; % is per cent; kt is thousand tonnes; Mt is mega or million tonnes); except diamonds which are in carats (where 1 carat = 0.2 grams).
The vast majority of data is calendar year, but from the 1980s onwards some data is financial year (i.e., July to June).
Where value only was reported, this has been converted to metal / mineral based on average prices for that year.
Whilst every effort has been made to reconcile conflicting data sources, some conflicts and inconsistencies remain - if there is a need to address this, please contact the author.
It is anticipated that additional updates will be included in future (e.g., years beyond 2021, additional minerals) - if there is a desire for help with particular research or analyses, the author is most willing to be consulted and may be able to help.
Very minor differences remain between mine production time series (e.g., mined Cu production in column BP) and totals in the Summary or Mine by Mine tabs.
Any errors - or even additional data to amend or add - please contact the author.
and this:
Note: This synthesis does not include industrial and construction minerals and materials (e.g., aggregates, sand, barite, limestone, clays, dimension stone, etc).
“Annual data” sheet
I focused on the “Annual Data” sheet.
To create unique column names, I appended the contents of row 8, 9, and 10. For example
Gold
QLD
kg Au
becomes Gold_QLD_kg AU.
This works everywhere except the \(ThO_2\) phosphate mineral Monazite_WA_%ThO2, which is repeated in columns 353 and 358 row 10. The first time it refers to monazite but the second time to monazite in WA grouped with xenotime (both “…are sometimes grouped in the informal ‘anhydrous phosphates’ group”) xenotime. So I manually appended “xenotime” in cell MT10 to get Monazite_WA_%ThO2_xenotime.
Although I eventually excluded the following items, in order to parse the spreadsheet, I un-merged cells in row 8 and copied the relevant string to each of the merged cells:
Platinum Group Elements by Individual Element in HO8:HT8
Data for diamonds in 2021 is missing (cells BT233, BV233, BX233). Since production has been on a downward trend since 2017, I estimated 2021 production by averaging the decline the prior two years and subtracting it from 2020 production.
In the spreadsheet Ilmenite in year 1932 (cell JV144) has character data rather than number in the cell, which converted to NA (missing data). “Ilmenite is the most important ore of titanium and the main source of titanium dioxide, which is used in paints, printing inks, fabrics, plastics, paper, sunscreen, food and cosmetics.”1
I used the “Australia” summary columns, but not the additional columns labeled ‘ABARE’. From the “Notes” page of the spreadsheet: ABARE is a principal national reference for quarterly and annual statistics:
ABARE, Australian Mineral Statistics (quarterly journal). Australian Bureau of Agricultural and Resource Economics (ABARE; now Australian Bureau of Agricultural and Resource Economics & Sciences), Canberra, ACT, Australia, Years 1988 to 2011.
ABARE, Australian Commodity Statistics (annual series). Australian Bureau of Agricultural and Resource Economics (ABARE; now Australian Bureau of Agricultural and Resource Economics & Sciences), Canberra, ACT, Australia, Years 1995 to 2010 (formerly Commodity Statistical Bulletin, 1986-1994).
Data cleaning to report on less common elements
“Rare Earths” (HZ8:IA:8)
Garnet (JD8:JE8)
Rutile (LC8:LD8) is \(TiO_2\) most commonly used in sunscreens and smelting Titanium metal2.
Synthetic Rutile (LH8, LJ8) from WA only (no ‘Australia’ columns); it’s typically made from Ilmenite.
I skipped the following due to missing price data or limited volume data * “Platinum Group Elements by Individual Element” (HO8:HT8) would be the best set of columns to use for PGEs, however there is no pricing data. Note that some have not been mined since the 1950s * Niobium (IU8) ( there is no price column) * admium (IZ8) ( there is no price column and not mined since 2004) * Zircon there os no $/t for all of Australia, and data is incomplete; prices diverge signficantly in the various states * Bismuth (not mined since 1984)
Triangulating with more authoritative sources
Numbers are unlikely to match for the following reasons:
One could report the amounts (1) mined, (2) produced (which may include imports beneficieated or otherwise processed in Australia), and (3) exported (some output is consumed domestically). I’m using the column from Mudd’s data that are (2) I believe.
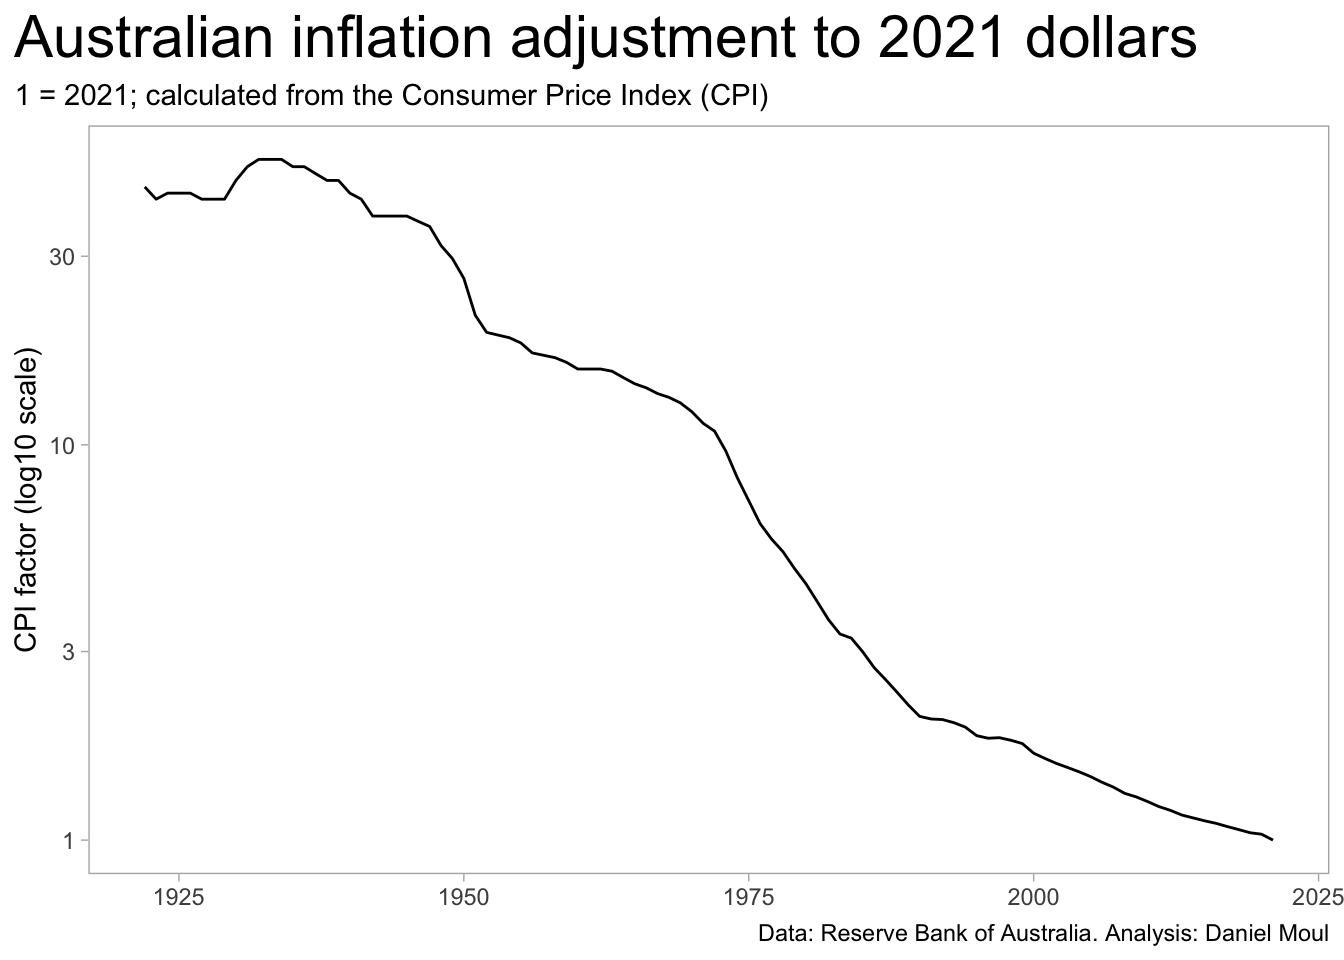
Rather than using CPI to calculate constant dollars, one could choose other measures of inflation more centered on mining or manufacturing. I chose CPI, because it’s the measure for which the RBA provides 100 years of data. It’s also the most common and familiar measure.
Percentages of total production won’t match exactly, since I excluded Platinum Group Elements (PGEs), Rare Earth Elements, Niobium, Bismuth, Gallium, and Vanadium due to small quantities mined, insufficient data points, incomplete data series as noted by the author, or the need for more involved data preparation to present them accurately.
Mudd made some generalizing assumptions documented in A Comprehensive dataset for Australian mine production 1799 to 2021 and in the master spreadsheet. See Section 2 in the Notes.
For example, Australia Iron Ore Mining Market by Reserves and Production, Assets and Projects, Fiscal Regime including Taxes and Royalties, Key Players and Forecast, 2021-20263 reports Australian iron ore market in 2021 was 922.2 Mt. This matches Mudd’s 2021 amount.
Compared to World Mining Data 20224 (which has 2020 data whereas I’m working with 2021 data)
My numbers are in similar ranges for the production of Cobalt, Nickel, Tungsten, Bauxite, Copper, Lead, Tin, Zinc, Gold, Silver
For Manganese and Tantalum I report about 200%
For Lithium I report about 50%
I have not attempted to reconcile prices or values of production with more authoritative sources. If any numbers seem wildly erroneous, please let me know.
https://www.world-mining-data.info/wmd/downloads/PDF/WMD2022.pdf volume 37. page 201-202. Published by the Austrian Federal Ministry of Agriculture, Regions and Tourism Stubenring 1, 1010 Vienna, on behalf of the International Organizing Committee for the World Mining Congress ↩︎