3  Risks

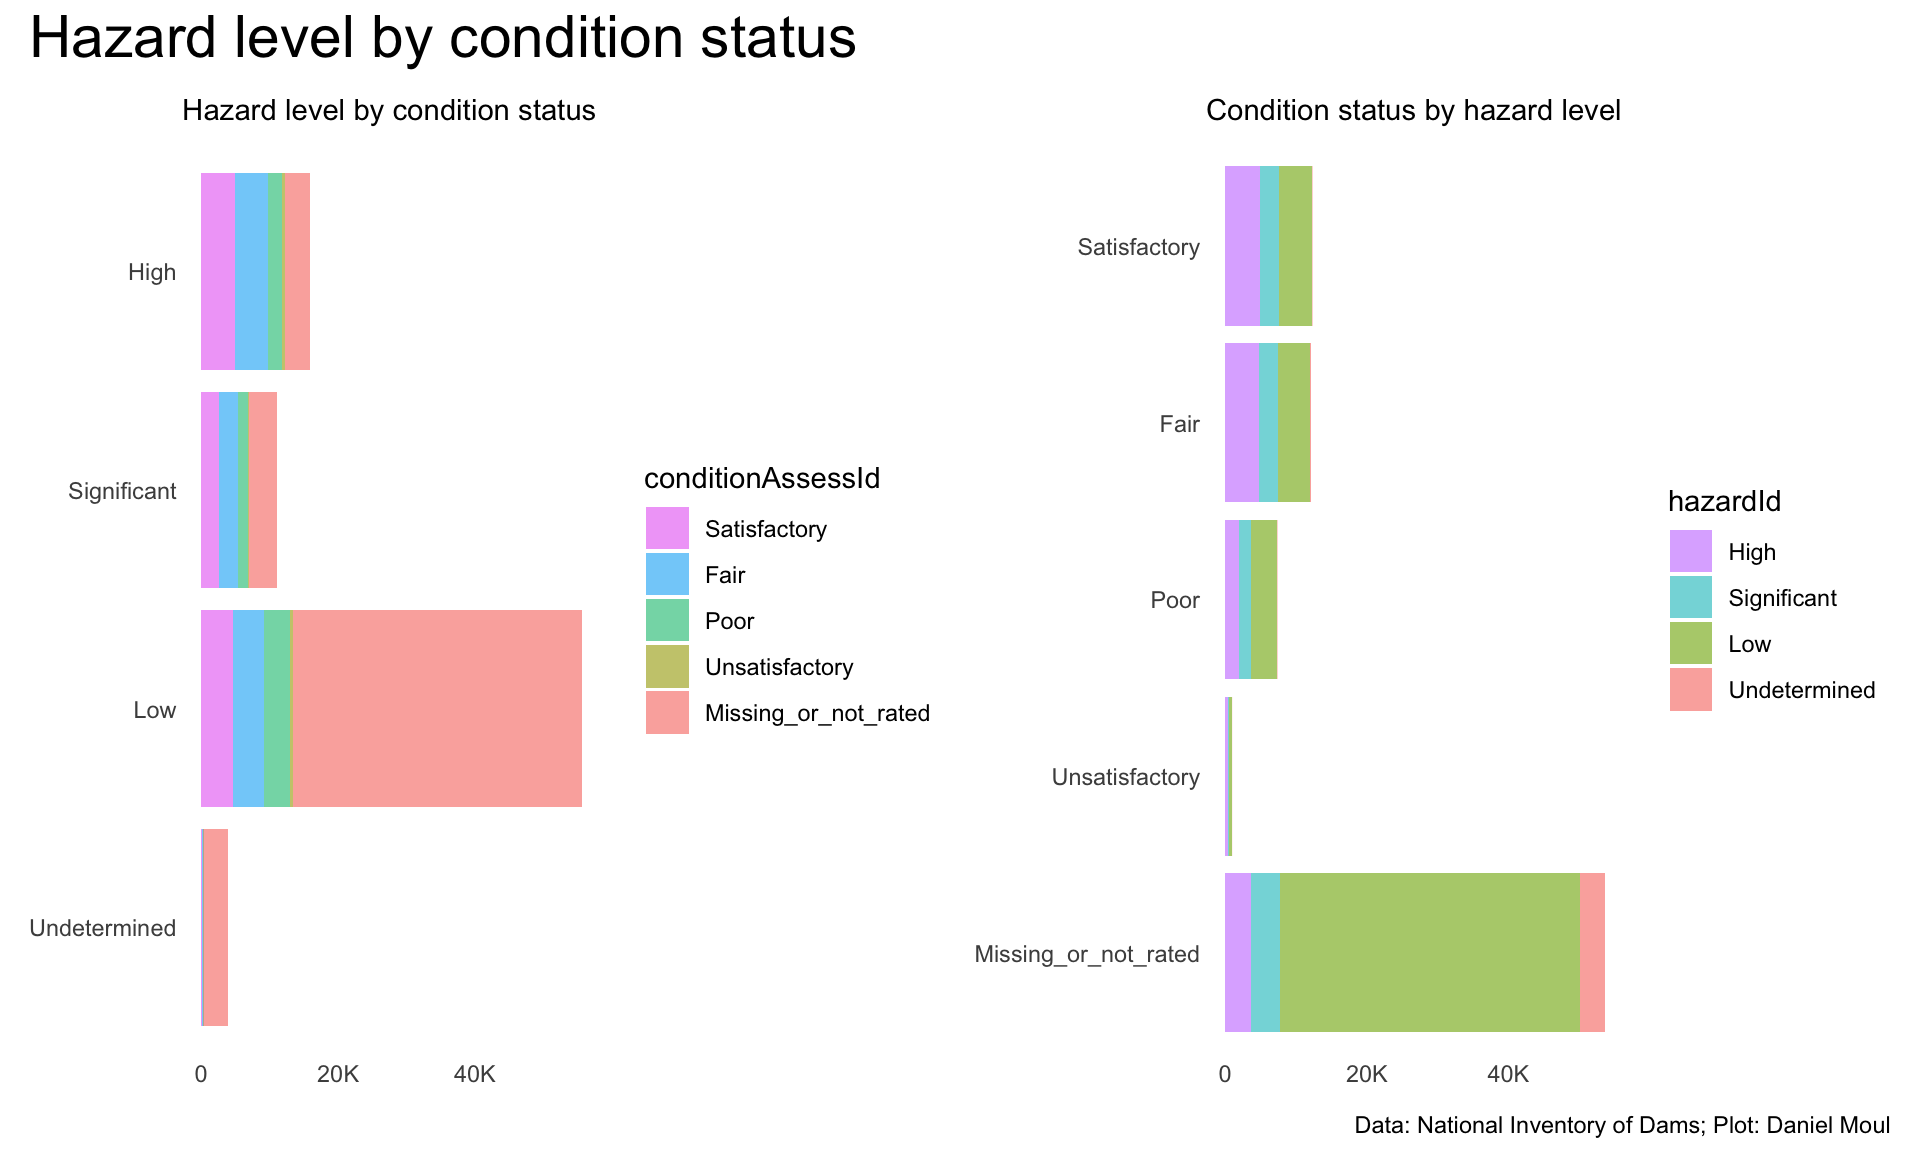
A primary reason for the National Inventory of Dams is to ensure that risks related to dams are adequately identified and managed.

The NID data dictionary defines the hazard classifications:

Hazard Potential Classification Category to indicate the potential hazard to the downstream area resulting from failure or mis-operation of the dam or facilities. It reflects probable loss of human life and impacts on economic, environmental, and lifeline interests. The hazard potential does not speak to the condition of the dam or the risk of the dam failing.

  • Low, Significant, High
  • Undetermined, Not Available [not in our data set]

Definitions, as accepted by the Interagency Committee on Dam Safety, are as follows:

  • Low Hazard Potential: Dams assigned the low hazard potential classification are those where failure or mis-operation results in no probable loss of human life and low economic and/or environmental losses. Losses are principally limited to the owner’s property.
  • Significant Hazard Potential: Dams assigned the significant hazard potential classification are those dams where failure or mis-operation results in no probable loss of human life but can cause economic loss, environment damage, disruption of lifeline facilities, or impact other concerns. Significant hazard potential classification dams are often located in predominantly rural or agricultural areas but could be in areas with population and significant infrastructure.
  • High Hazard Potential: Dams assigned the high hazard potential classification are those where failure or mis-operation will probably cause loss of human life.


3.1 Dam condition

Show the code
dta_for_plot <- dams_no_geo |>
  count(hazardId, conditionAssessId)

p1 <- dta_for_plot |>
  ggplot() +
  geom_col(aes(n, hazardId, fill = conditionAssessId)) +
  scale_x_continuous(labels = label_number(scale_cut = cut_short_scale())) +
  guides(fill = guide_legend(reverse = TRUE)) +
  labs(
    subtitle = "Hazard level by condition status",
    x = NULL,
    y = NULL
  )

p2 <- dta_for_plot |>
  ggplot() +
  geom_col(aes(n, conditionAssessId, fill = hazardId)) +
  scale_x_continuous(labels = label_number(scale_cut = cut_short_scale())) +
  guides(fill = guide_legend(reverse = TRUE)) +
  labs(
    subtitle = "Condition status by hazard level",
    x = NULL,
    y = NULL
  )

p1 + p2 +
  plot_annotation(
    title = "Hazard level by condition status",
    caption = my_caption
  )
Figure 3.1: Dam hazard levels and condition assessment (continental states)


Very few are rated “Unsatisfactory”

Show the code
# unsat <- dams_no_geo |>
#   filter(conditionAssessId == "Unsatisfactory") |>
#   count(nidHeightId)
# 
# poor <- dams_no_geo |>
#   filter(conditionAssessId == "Poor") |>
#   count(nidHeightId)

dams_no_geo |>
  count(hazardId, conditionAssessId, nidHeightId) |>
  ggplot() +
  geom_col(aes(n, hazardId, fill = conditionAssessId)) +
  scale_x_continuous(labels = label_number(scale_cut = cut_short_scale())) +
  facet_wrap(~nidHeightId) +
  guides(fill = guide_legend(position = "inside")) +
  theme(legend.position.inside = c(0.8, 0.3)) +
  labs(
    title = "Dam hazard levels and condition assessment\nby dam height",
    x = NULL,
    y = NULL,
    caption = my_caption
  )

dams_no_geo |>
  count(hazardId, conditionAssessId, nidHeightId) |>
  ggplot() +
  geom_col(aes(n, hazardId, fill = nidHeightId)) +
  scale_x_continuous(labels = label_number(scale_cut = cut_short_scale())) +
  facet_wrap(~conditionAssessId) +
  guides(fill = guide_legend(position = "inside")) +
  theme(legend.position.inside = c(0.8, 0.3)) +
  labs(
    title = "Dam hazard levels and condition assessment\nby dam height",
    x = NULL,
    y = NULL,
    caption = my_caption
  )

dams_no_geo |>
  filter(conditionAssessId %in% c("Unsatisfactory", "Poor", "Fair")) |>
  count(hazardId, conditionAssessId, nidHeightId) |>
  ggplot() +
  geom_col(aes(n, hazardId, fill = nidHeightId)) +
  scale_x_continuous(labels = label_number(scale_cut = cut_short_scale())) +
  facet_wrap(~conditionAssessId, ncol = 2) +
  guides(fill = guide_legend(position = "inside")) +
  theme(legend.position.inside = c(0.8, 0.3)) +
  labs(
    title = "Dam hazard levels and condition assessment\nby dam height",
    x = NULL,
    y = NULL,
    caption = my_caption
  )
Figure 3.2: Dam hazard levels and condition assessment (continental states)
Figure 3.3: Dam hazard levels and condition assessment (continental states)
Figure 3.4: Dam hazard levels and condition assessment (continental states)


Big dams with Unsatisfactory or Poor condition:

Show the code
dta_for_plot <- dams_no_geo |>
  filter(conditionAssessId %in% c("Unsatisfactory", "Poor"),
         big_dam) |>
  count(hazardId, conditionAssessId, nidHeightId)

n_dams_big_unsat_poor = sum(dta_for_plot$n)

dta_for_plot |>
  ggplot() +
  geom_col(aes(n, hazardId, fill = nidHeightId)) +
  scale_x_continuous(labels = label_number(scale_cut = cut_short_scale())) +
  facet_wrap(~conditionAssessId, ncol = 2) +
  guides(fill = guide_legend(position = "inside")) +
  theme(legend.position.inside = c(0.8, 0.3)) +
  labs(
    title = glue("{n_dams_big_unsat_poor} big dams have assessment\nof Unsatisfactory or Poor"),
    x = NULL,
    y = "HazardId",
    caption = my_caption
  )
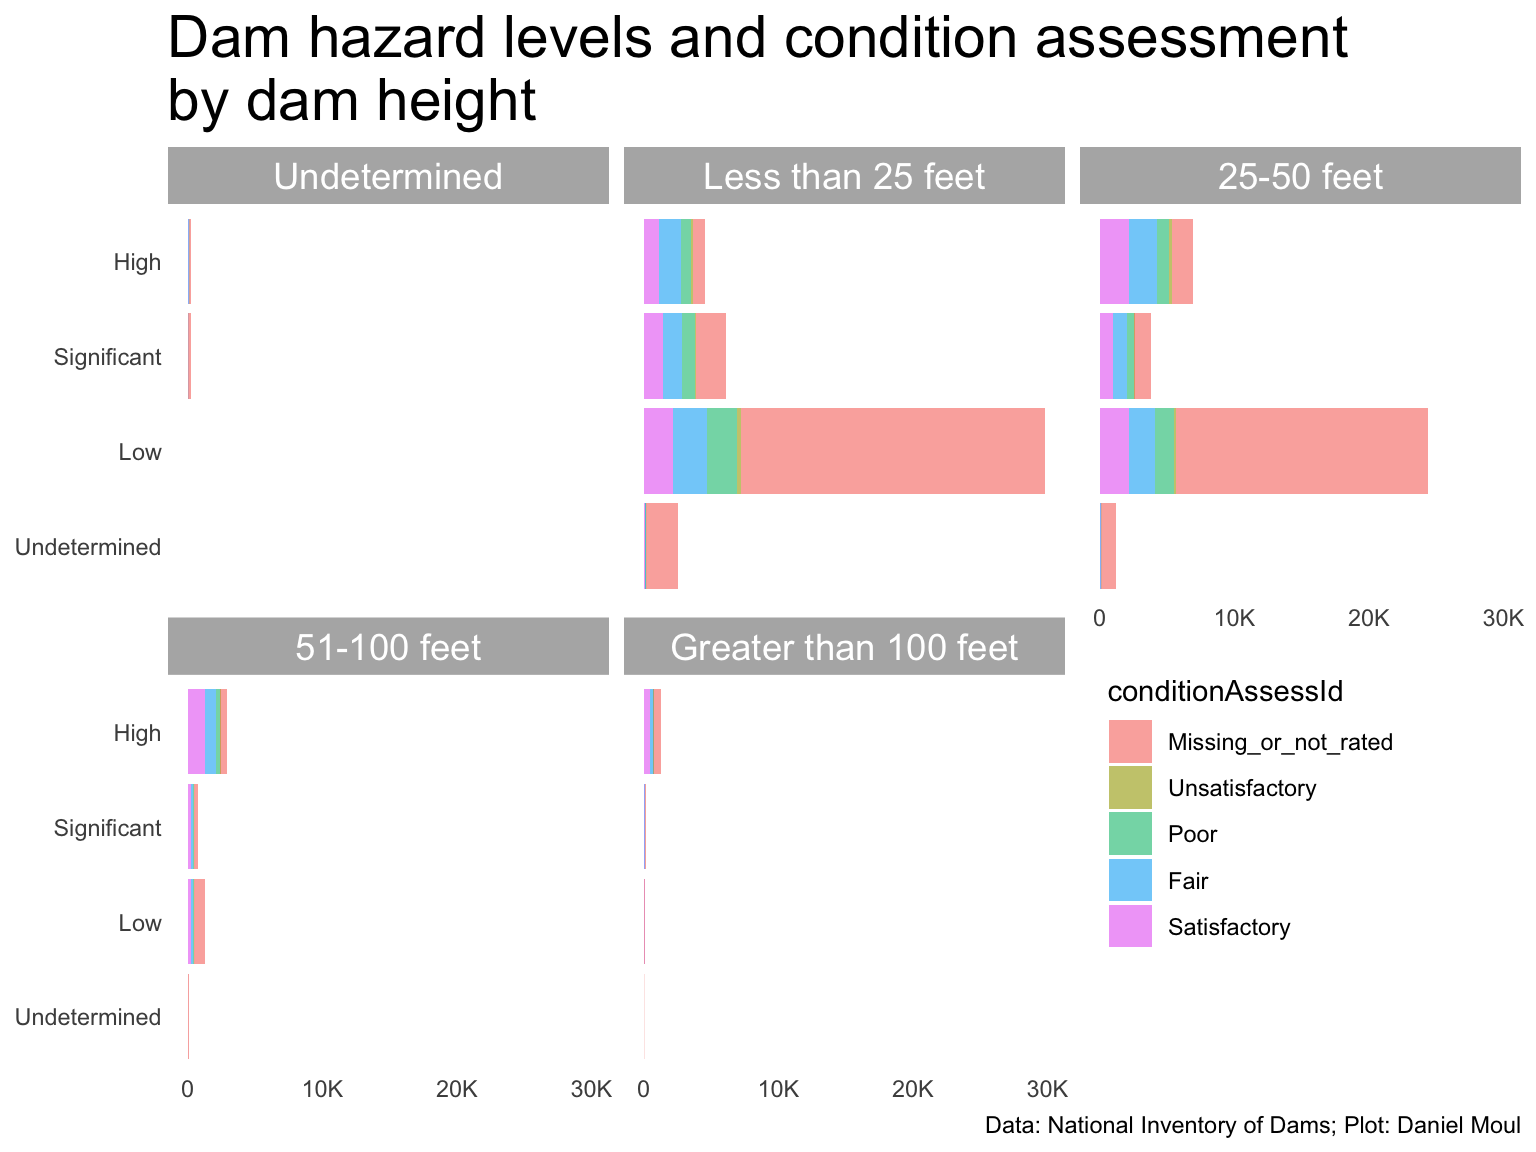
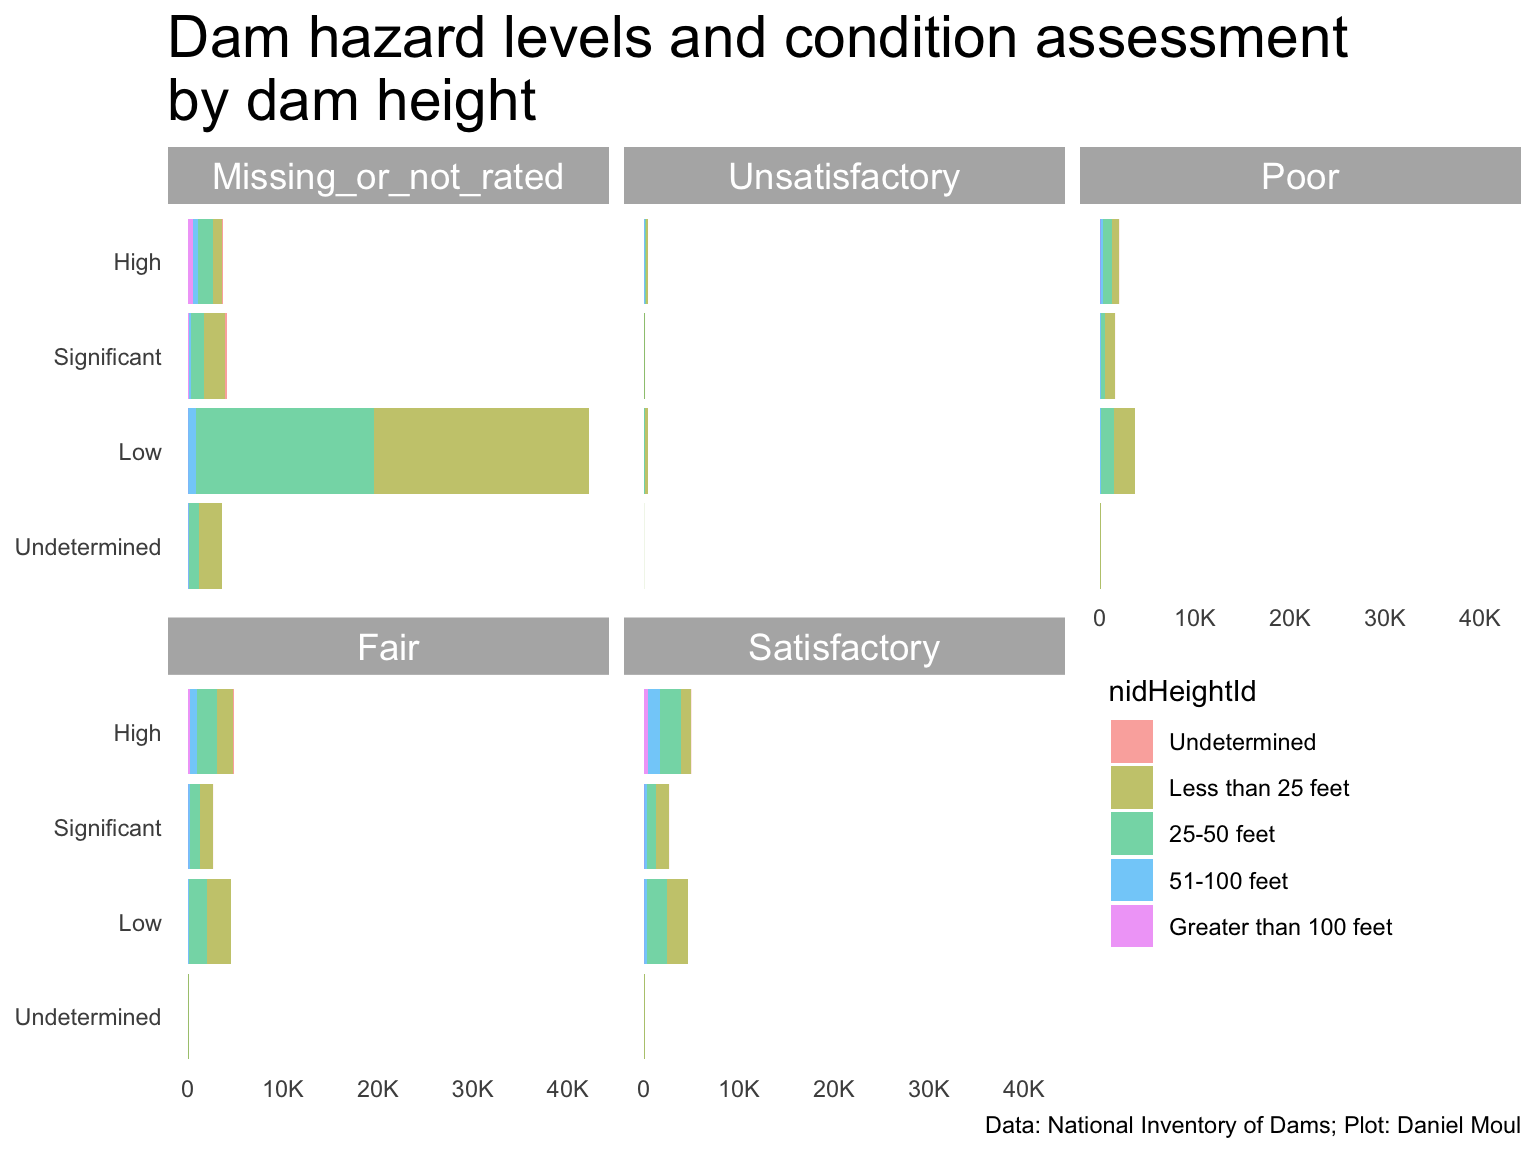
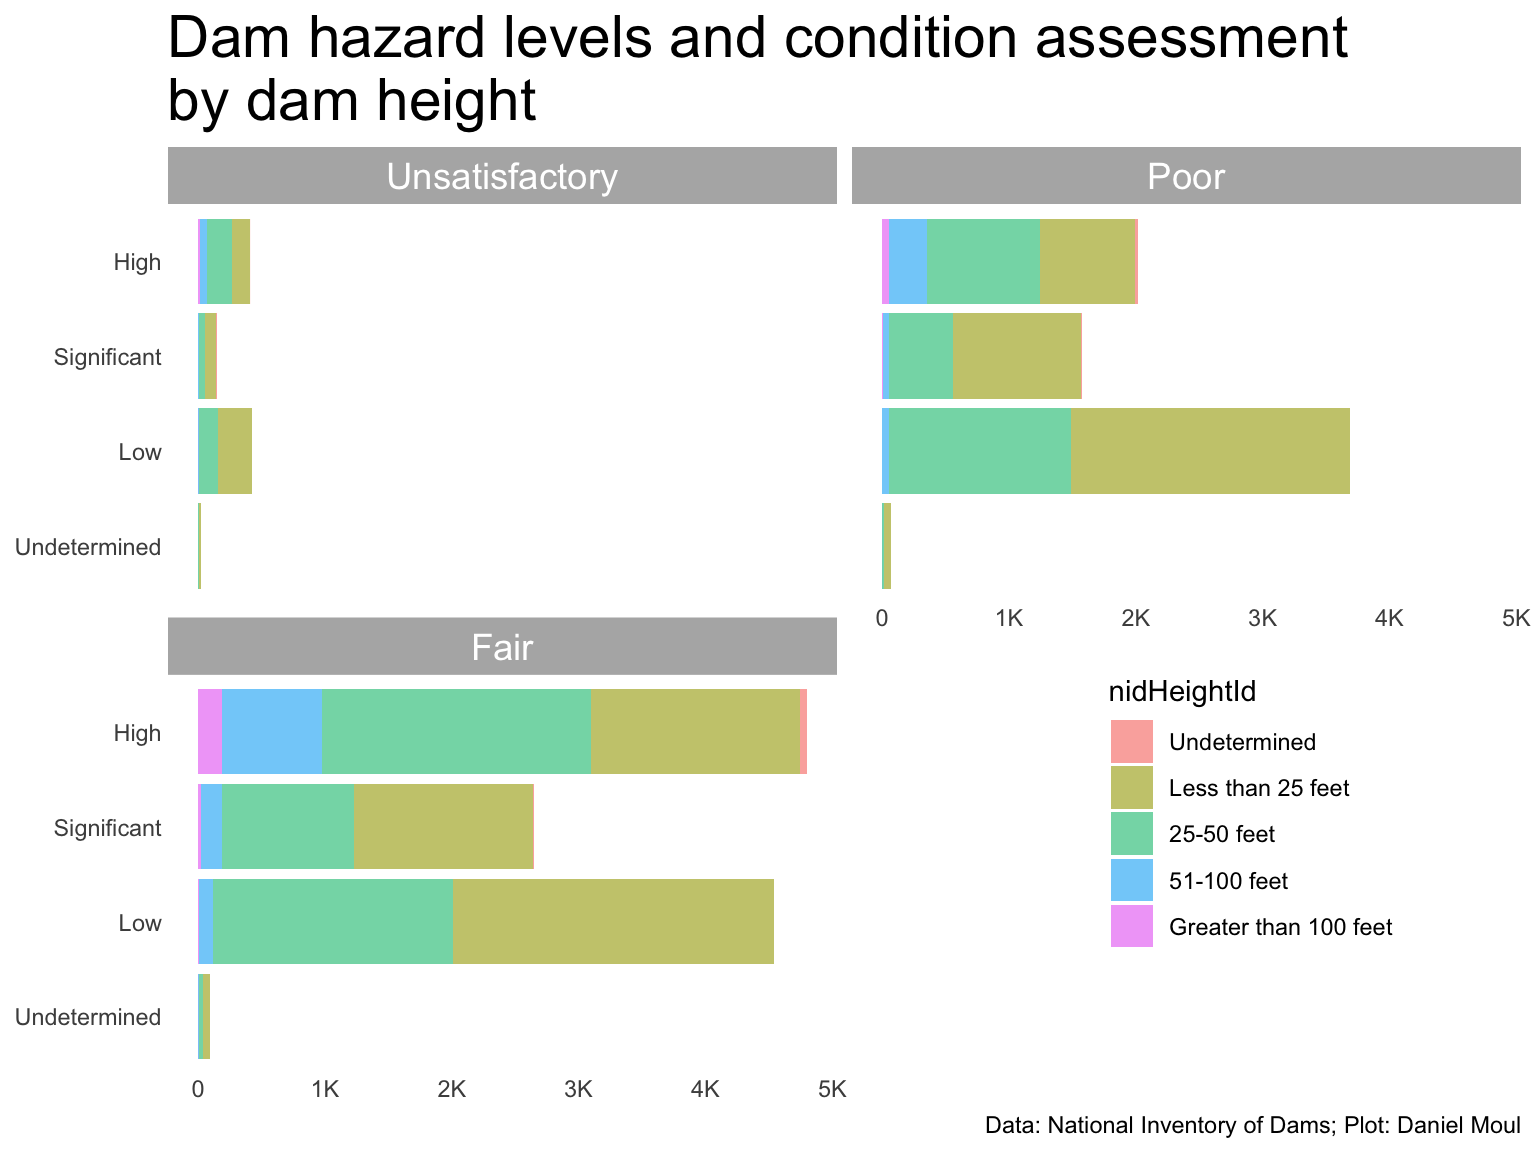
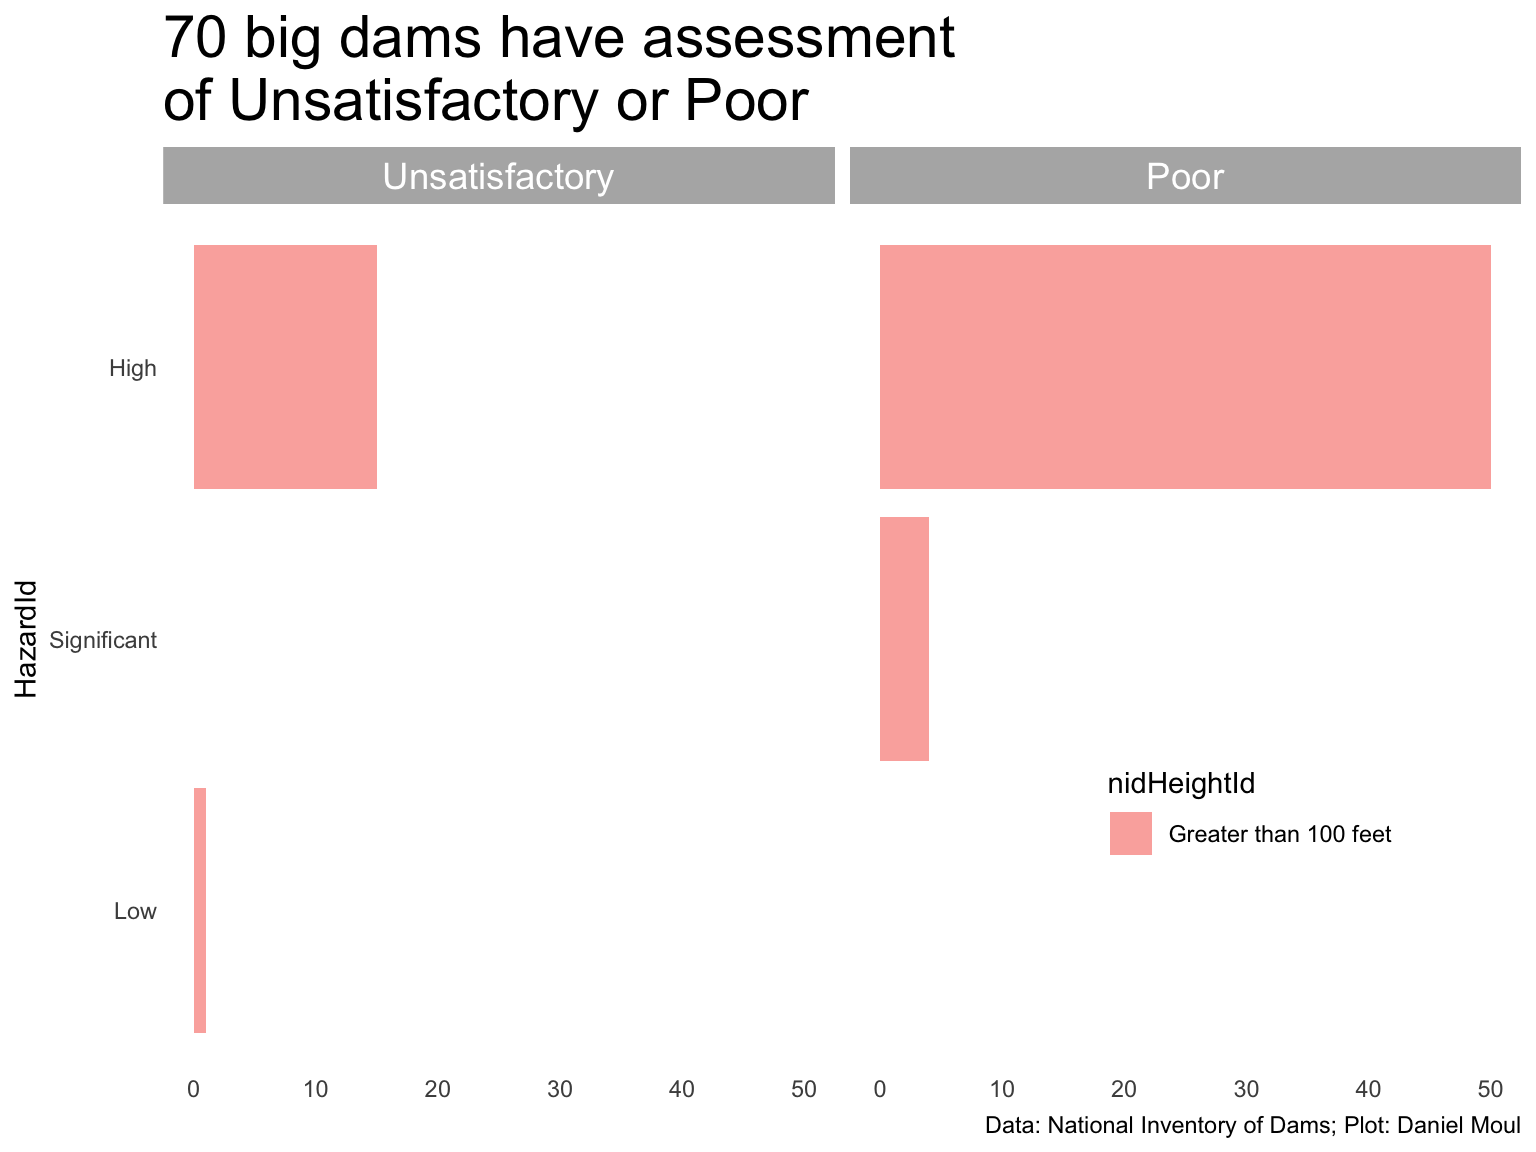
Figure 3.5: High hazard levels and unsatisfactory or poor condition


Most risky: over 100 ft, high hazard level, and unsatisfactory rating:

Show the code
dams_no_geo |>
  filter(hazardId == "High",
         conditionAssessId == "Unsatisfactory",
         nidHeightId == "Greater than 100 feet") |>
  select(name, nidId, state, primaryPurposeId, nidHeight, nidStorage, hazardId, conditionAssessDate, eapId, eapLastRevDate, ownerNames) |>
  arrange(desc(nidStorage)) |>
  mutate(idx = row_number()) |>
  relocate(idx) |>
  gt() |>
  tab_options(table.font.size = 10) |>
  tab_header(md("**Big dams with high hazard level and unsatisfactory condition**"))
Table 3.1: Short list: High hazard level and unsatisfactory condition
Big dams with high hazard level and unsatisfactory condition
idx name nidId state primaryPurposeId nidHeight nidStorage hazardId conditionAssessDate eapId eapLastRevDate ownerNames
1 Mossyrock WA00151 Washington Hydroelectric 606 1900000 High 2023-04-11 Yes 2022-12-30 City of Tacoma
2 Mayfield WA00152 Washington Hydroelectric 250 184194 High 2023-04-11 Yes 2022-12-30 City of Tacoma
3 Liberty Dam MD00003 Maryland Water Supply 175 177000 High 2022-04-22 No 2024-04-11 Baltimore City DPW Reservoir Section
4 Sanchez CO00790 Colorado Irrigation 137 137850 High 2022-07-22 Yes 2019-06-20 SANCHEZ DITCH AND RESERVOIR CO. (CALDON, KEITH)
5 Anderson CA00294 California Water Supply 240 89073 High 2023-09-29 Yes 2023-01-24 Santa Clara Valley Water District
6 Willow Creek 3 (Malheur) OR00390 Oregon Irrigation 110 49000 High 2021-09-30 Yes NA Orchards Water Co
7 Lake Hodges CA00108 California Water Supply 131 37700 High 2023-02-02 Yes 2019-06-04 City of San Diego
8 Laprele WY00204 Wyoming Irrigation 135 26850 High 2022-09-08 Yes 2011-04-01 LAPRELE IRRIGATION DISTRICT
9 Toronto NY00506 New York Hydroelectric 103 25211 High 2023-08-04 Yes 2021-11-02 Eagle Creek Hydro Power, LLC
10 Narraguinnep - Main Dam CO01089 Colorado Irrigation 114 22700 High 2023-05-23 Yes 2021-05-27 MONTEZUMA VALLEY IRRIGATION CO.
11 Smith OR00541 Oregon Hydroelectric 235 17530 High 2023-04-11 Yes 2022-12-31 Eugene Water and Electric Board
12 Fletcher Tailings Dam MO30160 Missouri Tailings 201 5333 High 2007-12-21 Yes 2018-05-01 DOE RUN COMPANY
13 Clear Branch OR00451 Oregon Irrigation 110 5290 High 2023-04-11 Yes 2022-12-06 Middle Fork Irrigation District
14 Hosler (Reeder Gulch OR00110 Oregon Water Supply 114 888 High 2023-04-11 Yes 2023-01-05 City of Ashland
15 Cat Creek NV10101 Nevada Water Supply 123 155 High 2022-10-02 Yes 2007-10-02 Hawthorne Army Depot


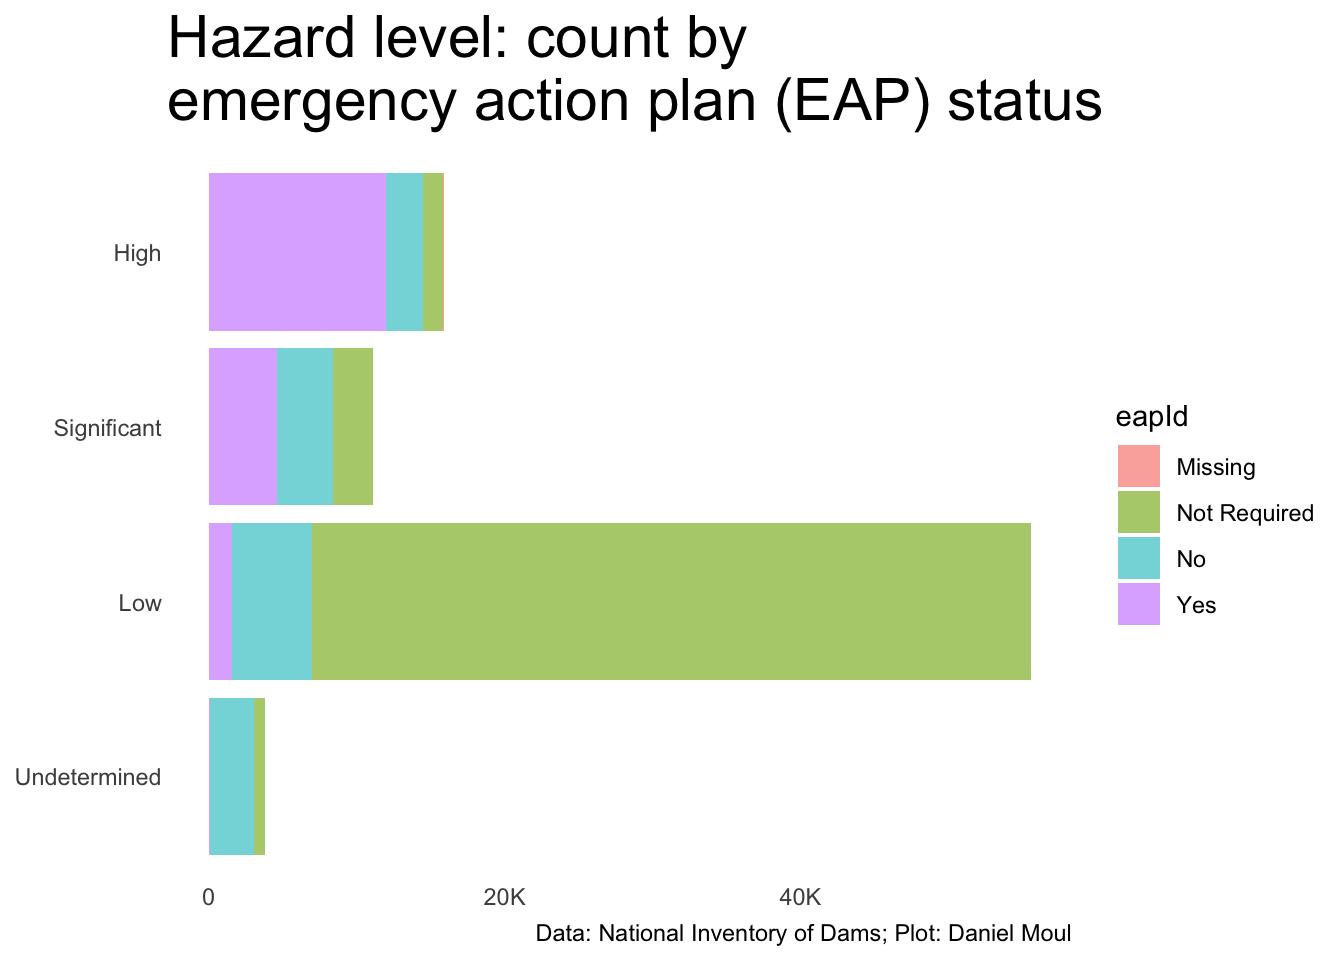
3.2 Dams for which an EAP is mandated

Emergency Action Plan (EAP Prepared) Indicating whether this dam has an Emergency Action Plan (EAP) developed by the dam owner. An EAP is defined as a plan of action to be taken to reduce the potential for property damage and loss of life in an area affected by a dam failure or large flood.

  • Yes
  • No
  • Not Required (by regulatory agency)

If an EAP is required (or not required) and has one, it will be listed as Yes. If an EAP is required and does not have one, it will be listed as No. If there is not an EAP and one is not required, it will be listed as Not Required.1

Show the code
dta_for_plot <- dams_no_geo |>
  count(hazardId, eapId)

dta_for_plot |>
  ggplot() +
  geom_col(aes(n, hazardId, fill = eapId)) +
  scale_x_continuous(labels = label_number(scale_cut = cut_short_scale())) +
  labs(
    title = "Hazard level: count by\nemergency action plan (EAP) status",
    x = NULL,
    y = NULL,
    caption = my_caption
    
  )

Show the code
dams_no_geo |>
  count(hazardId, eapId) |>
  mutate(prop_of_hazardId = n / sum(n),
         .by = hazardId) |>
  filter(eapId %in% c("Yes", "No")) |>
  gt() |>
  tab_header(md("**Dam hazard level and Emergency Action Plan**")) |>
  fmt_percent(columns = prop_of_hazardId,
              decimals = 0) |>
  cols_align(columns = c(hazardId, eapId),
             align = "left")
Dam hazard level and Emergency Action Plan
hazardId eapId n prop_of_hazardId
Undetermined No 2922 77%
Undetermined Yes 93 2%
Low No 5420 10%
Low Yes 1540 3%
Significant No 3809 34%
Significant Yes 4592 41%
High No 2523 16%
High Yes 11962 75%
Table 3.2: Dam hazard level and Emergency Action Plan


  1. NID data dictionary↩︎